Quantcast
Channel: Aras' website
Viewing all 256 articles
Browse latest View live

A look at 2016, and onto 2017

$
0
0

I don’t have any technical insights to share right now, so you’ll have to bear with me blabbering about random stuff!

Unity Work

By now it’s been 11 years at Unity (see 10 Years at Unity a year ago), and the last year has been interesting. Started out as written in that blog post – that I will be mostly doing plumbing & fixing and stuff.

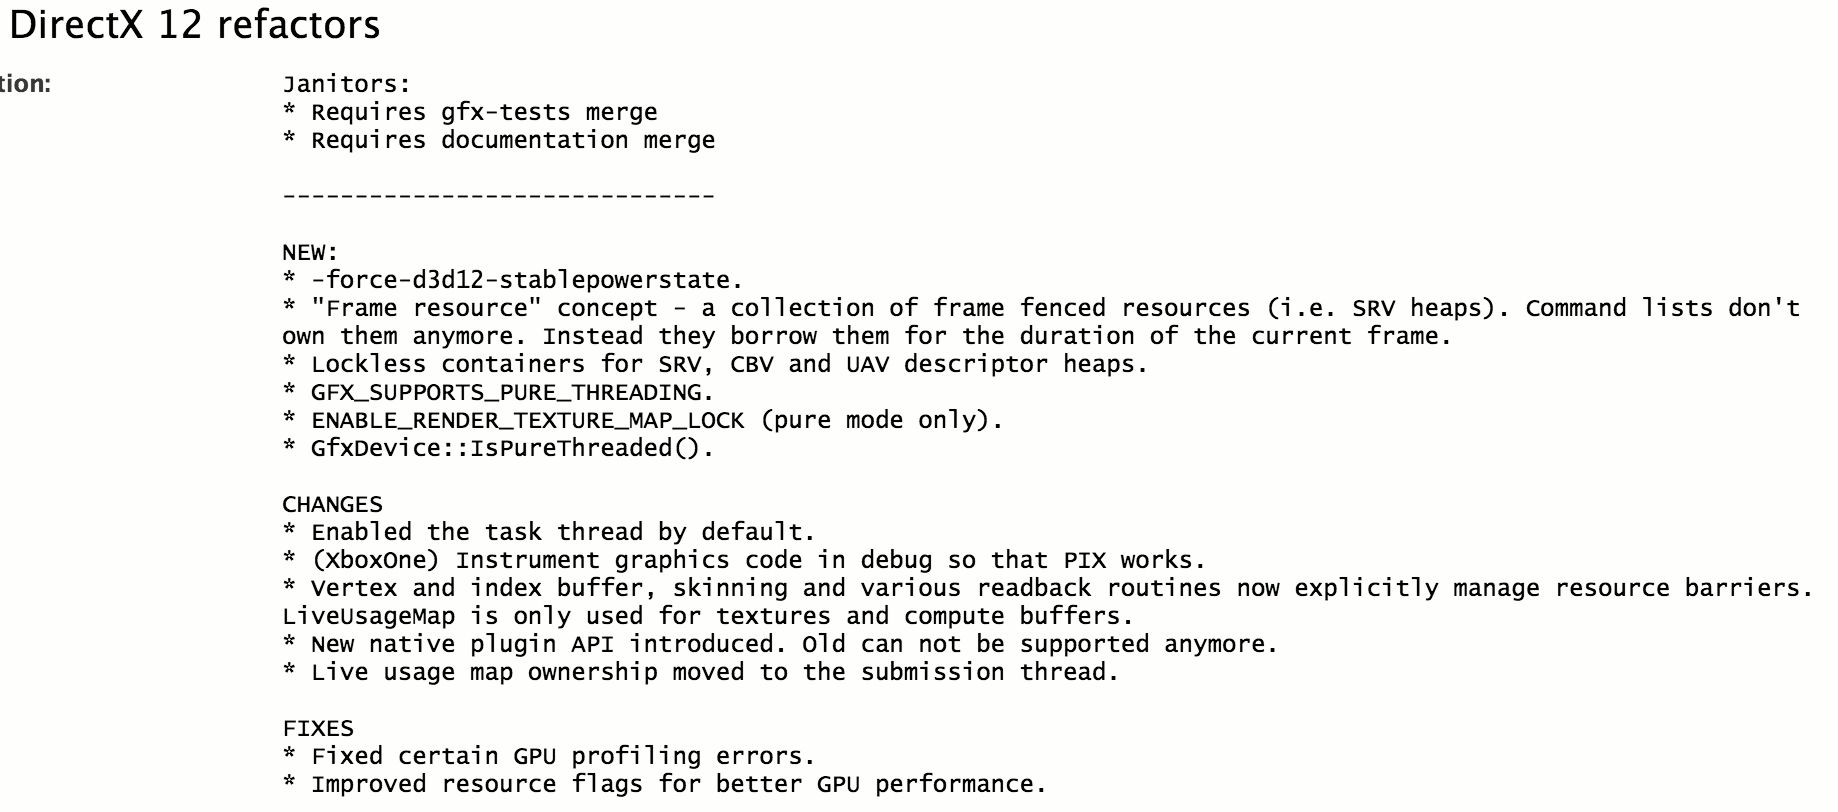
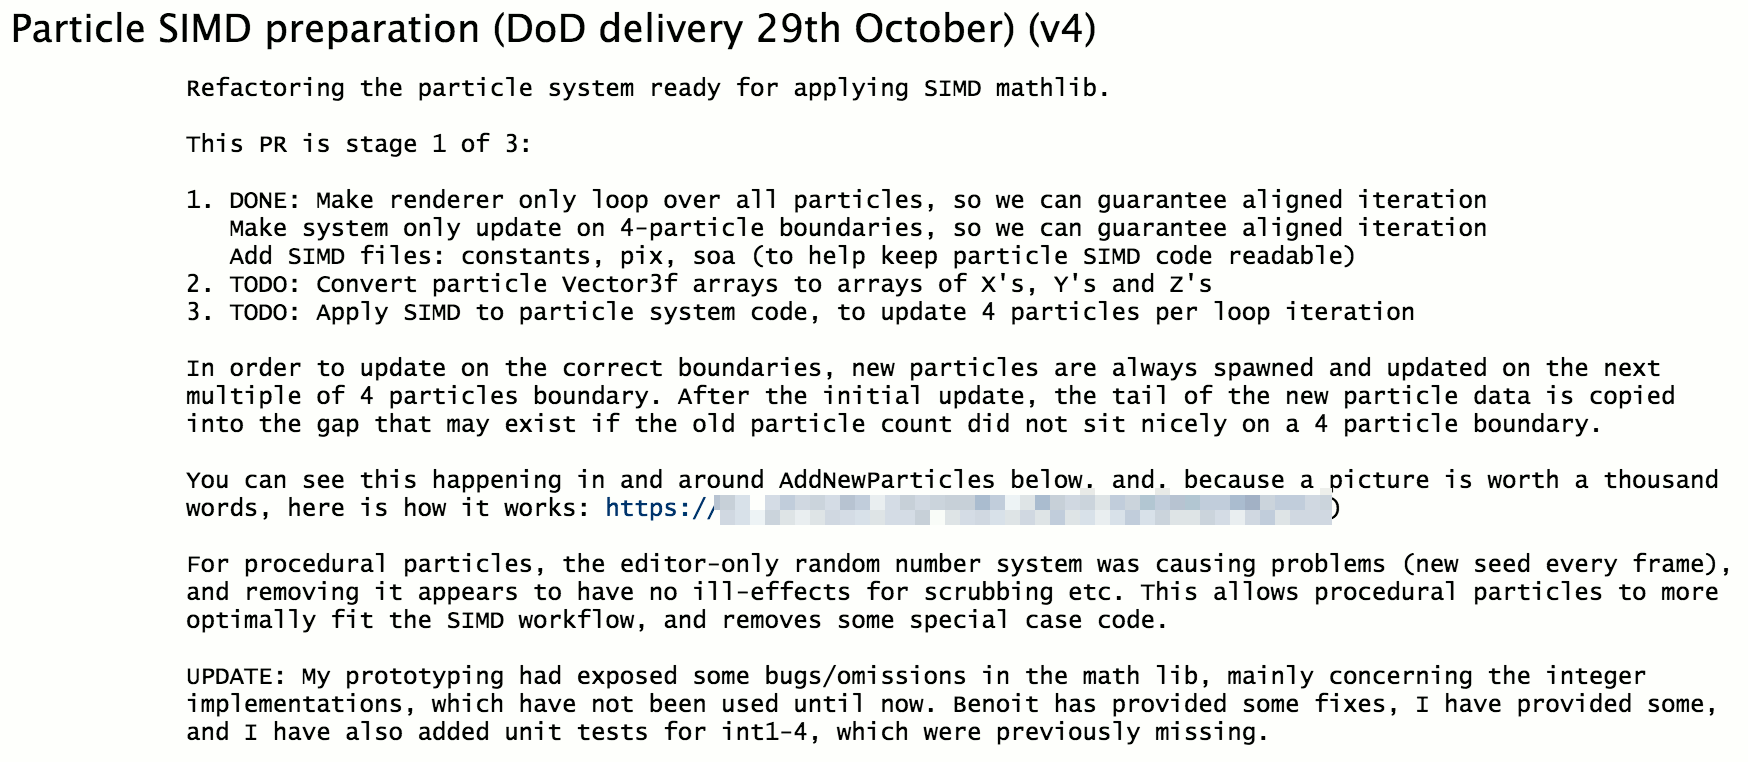
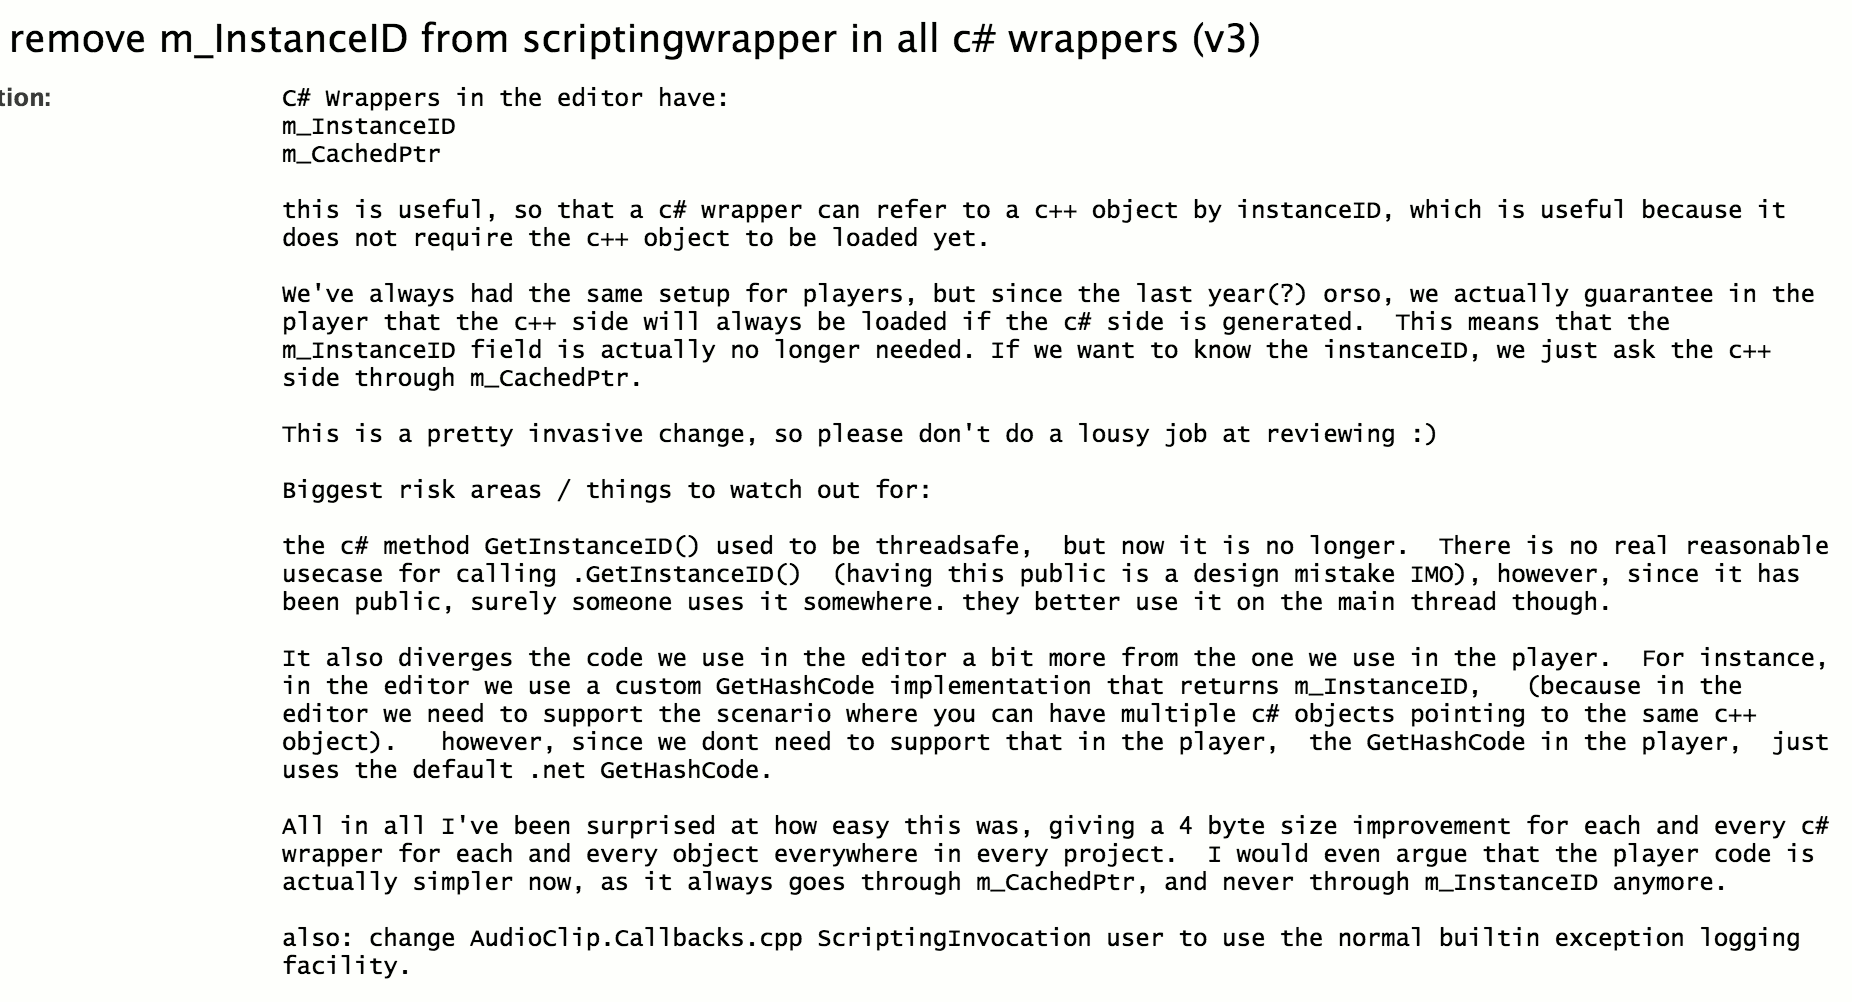
But then at some point we had a mini-hackweek of “what should the future rendering pipeline of Unity should be?”, and it went quite well. So a team with tasks of “build building blocks for future rendering pipelines” and “modernize low level graphics code” was built, see more on Scriptable Render Loops google doc and corresponding github project. I’ve been doing mostly, well, plumbing there, so nothing new on that front :) – but overall this is very exciting, and if done well could be a big improvement in how Unity’s graphics engine works & what people can do with it.

I’ve also been a “lead” of this low level graphics team (“graphics foundation team” as we call it), and (again) realized that I’m the worst lead the world has ever seen. To my fellow colleagues: sorry about that (シ. .)シ So I stopped being a lead, and that is now in the capable hands of @stramit.

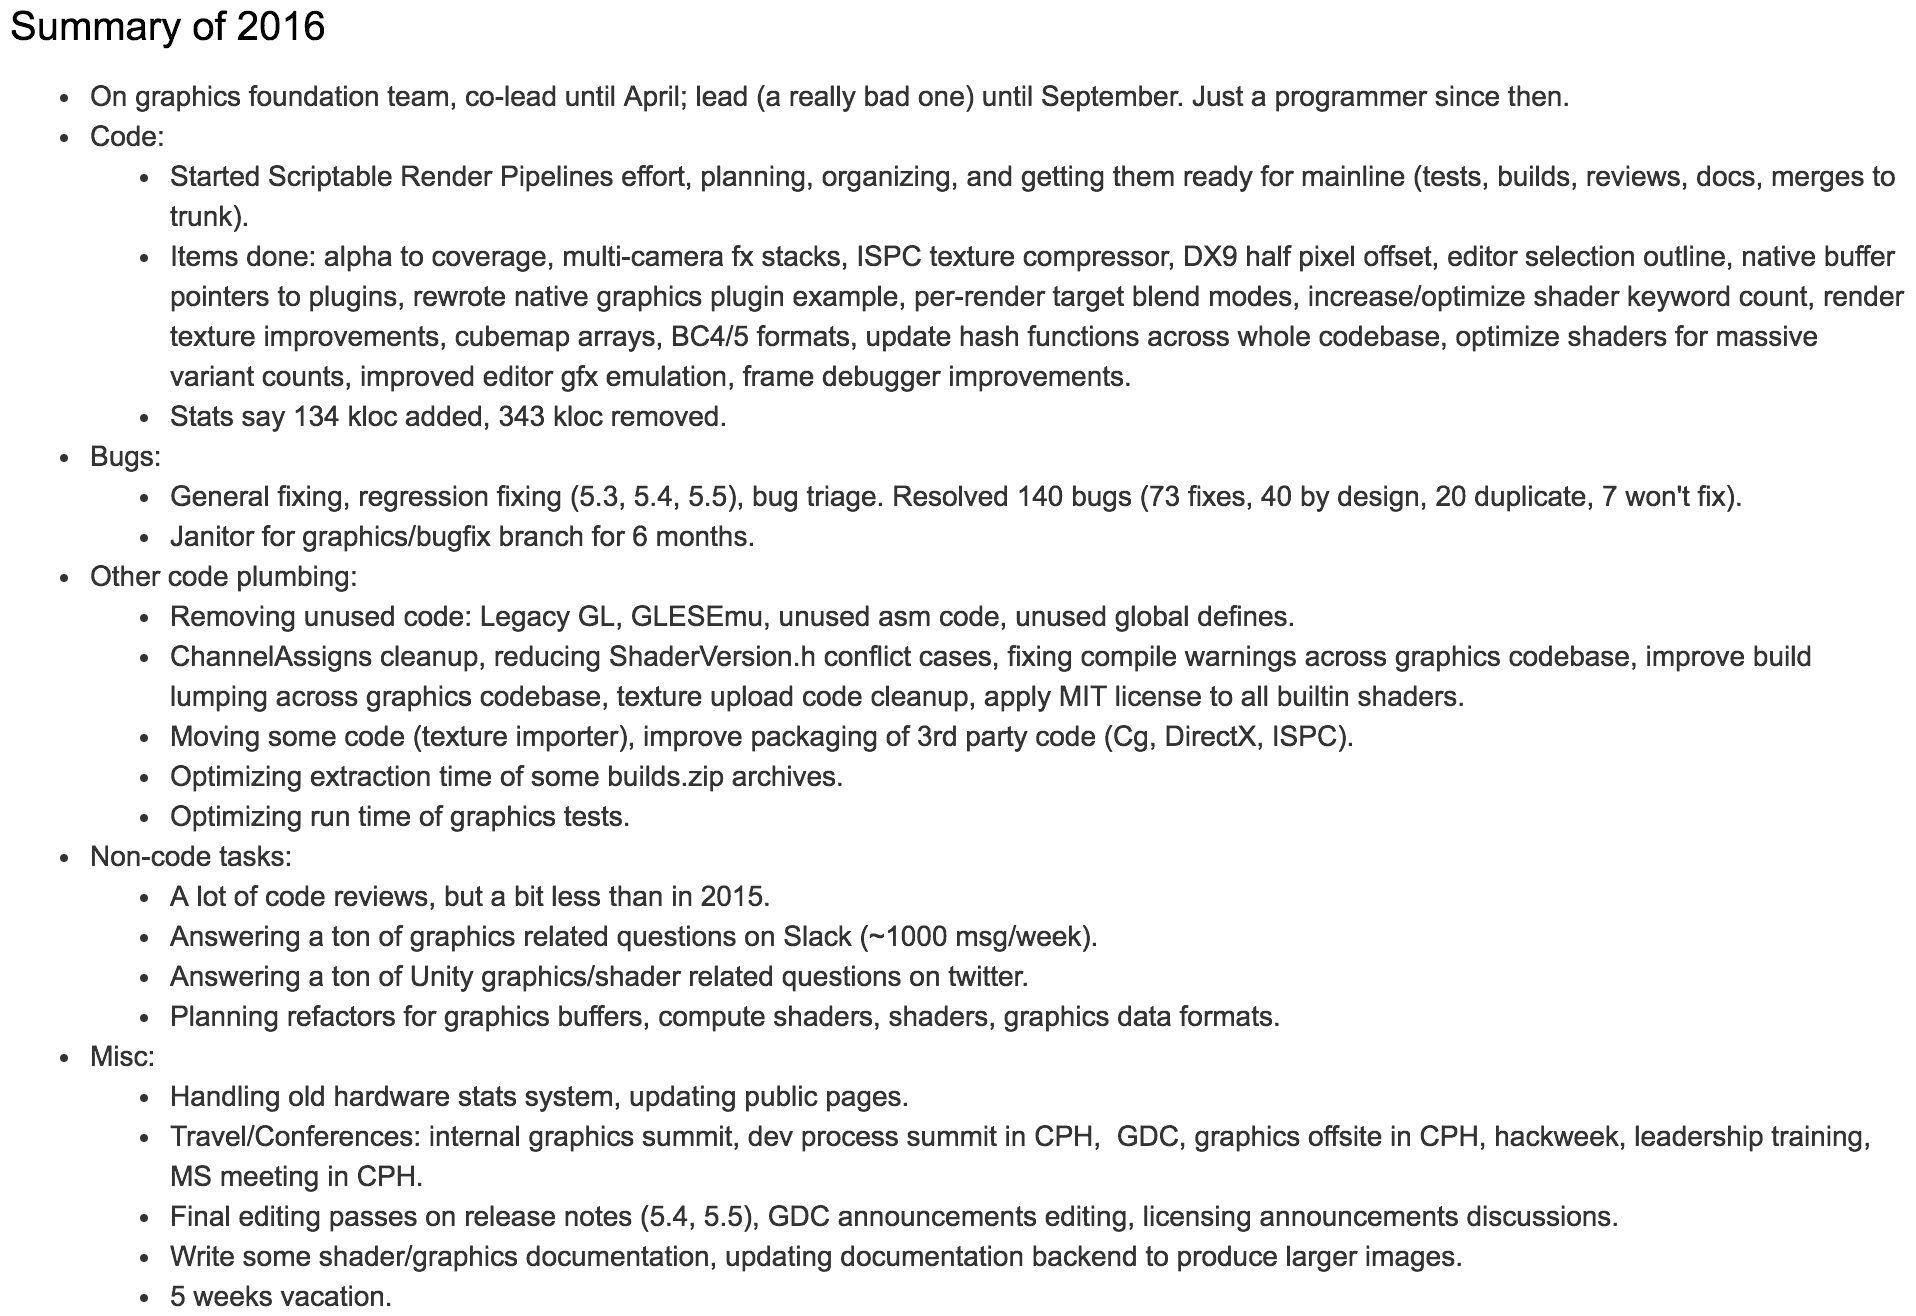
Each year I write a “summary of stuff I’ve done”, mostly for myself to see whether my expectations/plans matched reality. This year a big part in the mismatch has been because at start of year I did not know we’d go big into“let’s do scriptable render loops!”, otherwise it went as expected.

Day to day it feels a bit like “yeah, another day of plumbing”, but the summary does seem to indicate that I managed to get a decent amount of feature/improvement work done too. Nothing that would set the world on fire, but not bad either! Though thinking about it, after 2016, maybe the world could do with less things that set it on fire…

My current plan for next year is to continue working on scriptable render loops and whatever low level things they end up needing. But also perhaps try some new area for a bit, something where I’m a newbie and would have to learn some new things. We’ll see!

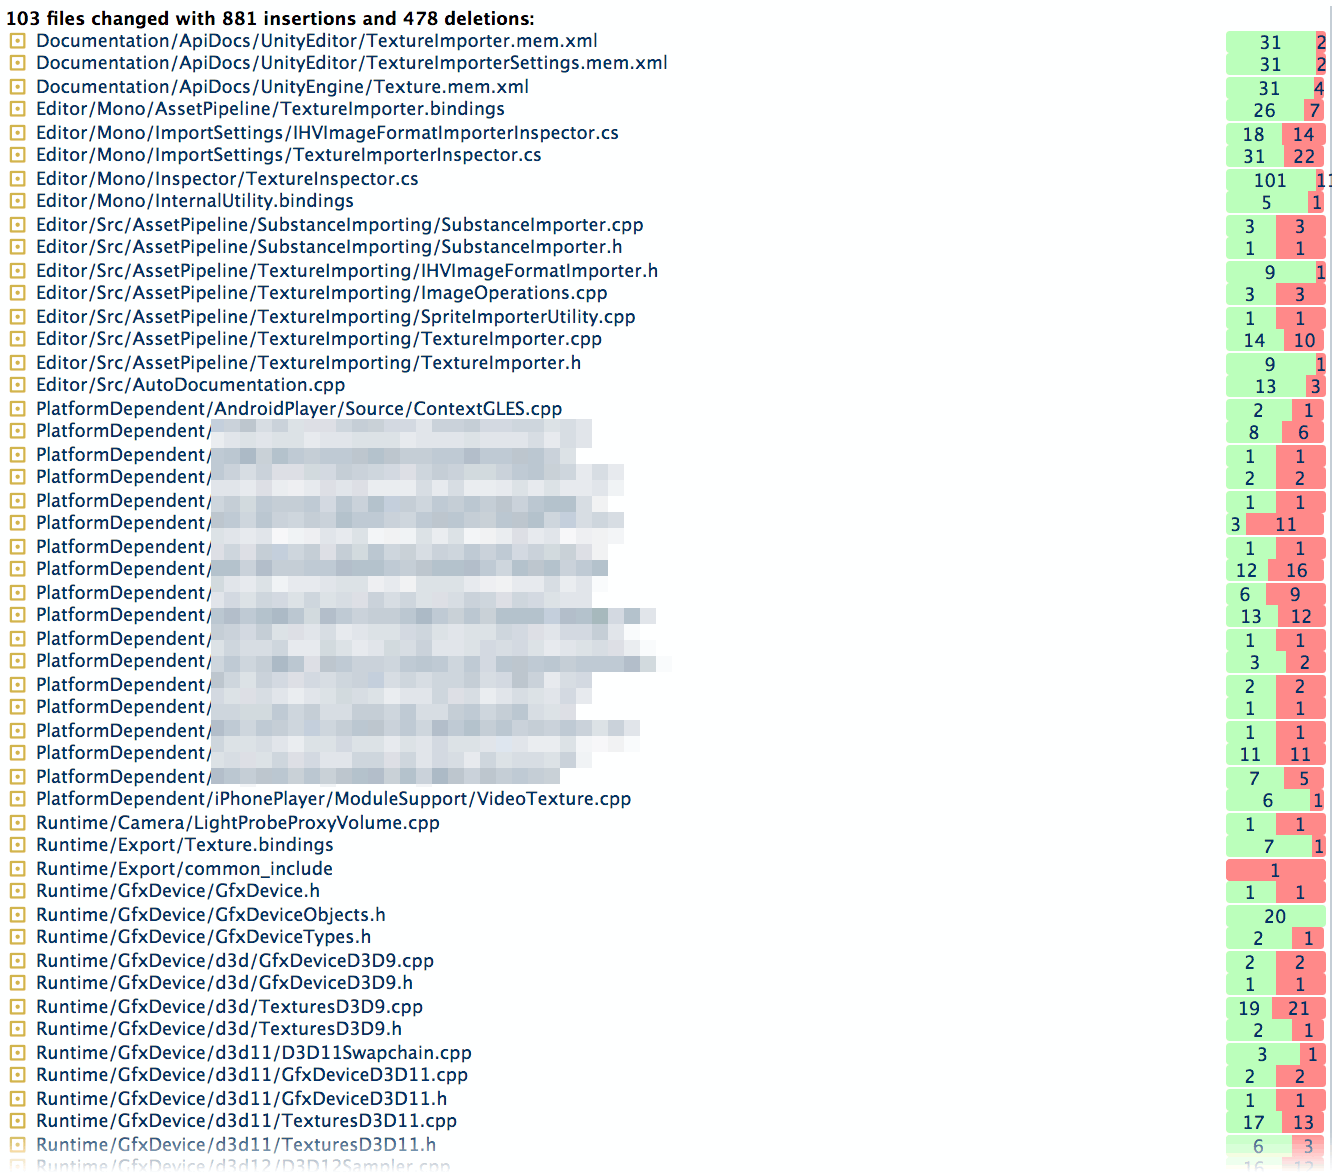
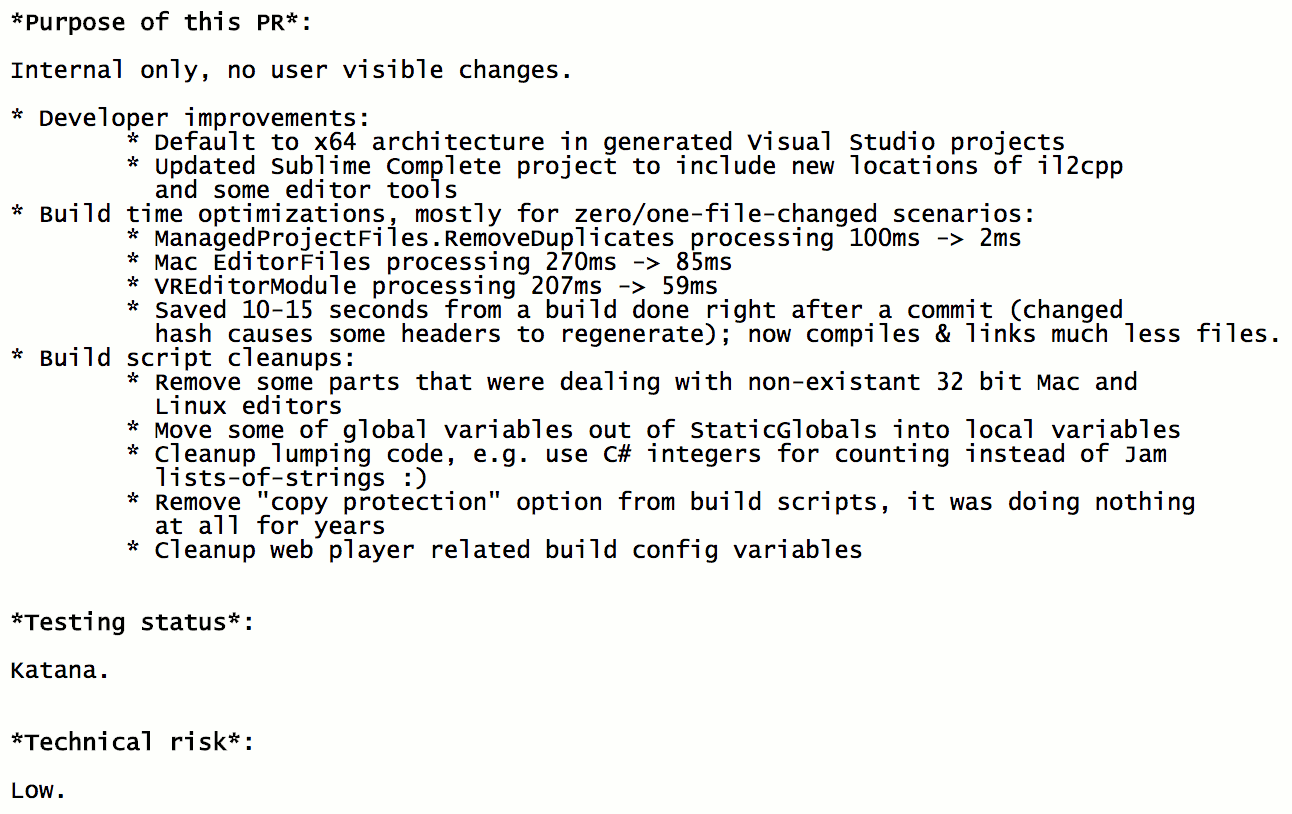
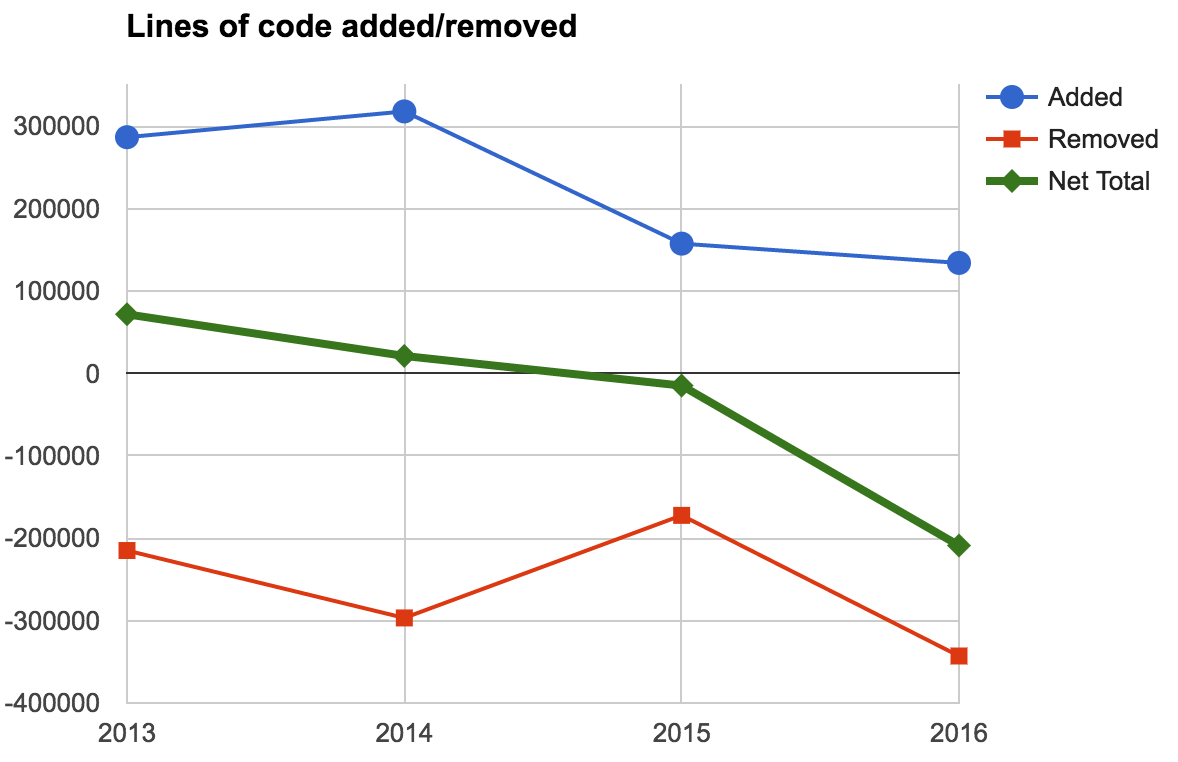
Oh, and extrapolating from the trend, I should effectively remove close to half a million lines of code this year. My fellow colleagues: brace yourselves :)

Open Source

My github contributions are not terribly impressive, but I managed to do better than in 2015.

  • Primarily SMOL-V, a SPIR-V shader compressor for Vulkan. It’s used in Unity now, and as far as I know, also used in two non-Unity game productions. If you use it (or tried it, but it did not work or whatever), I’d be happy to know!
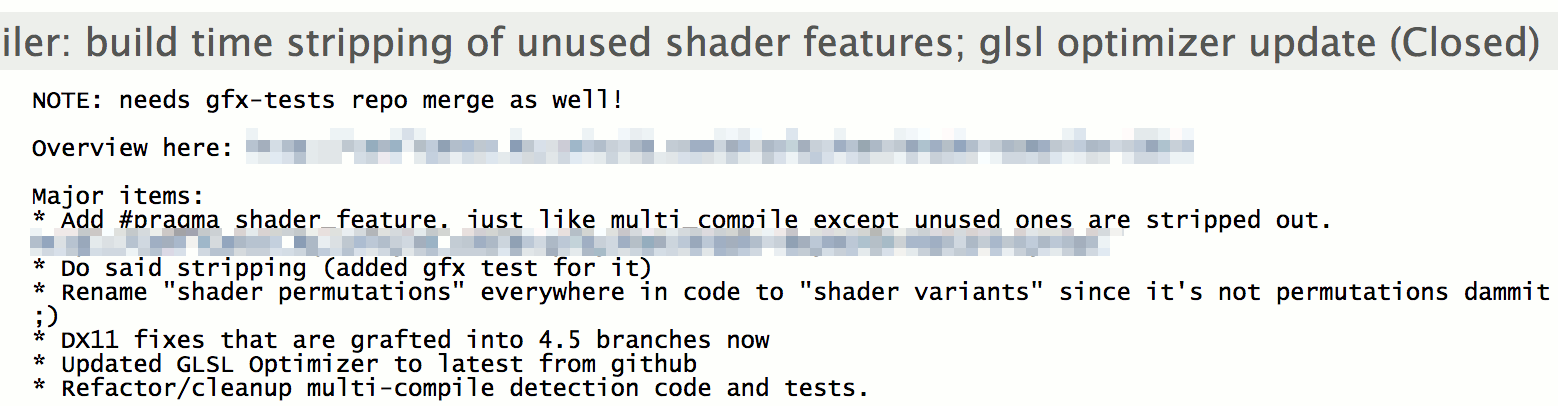
  • Small amount of things in GLSL Optimizer andHLSL2GLSL, but with Unity itself mostly moving to a different shader compiler toolchain (HLSLcc at the moment), work there has been winding down. I did not have time or will to go through the PRs & issues there, sorry about that.
  • A bunch of random tiny fixes or tweaks submitted to other github projects, nothing of note really.

Writing

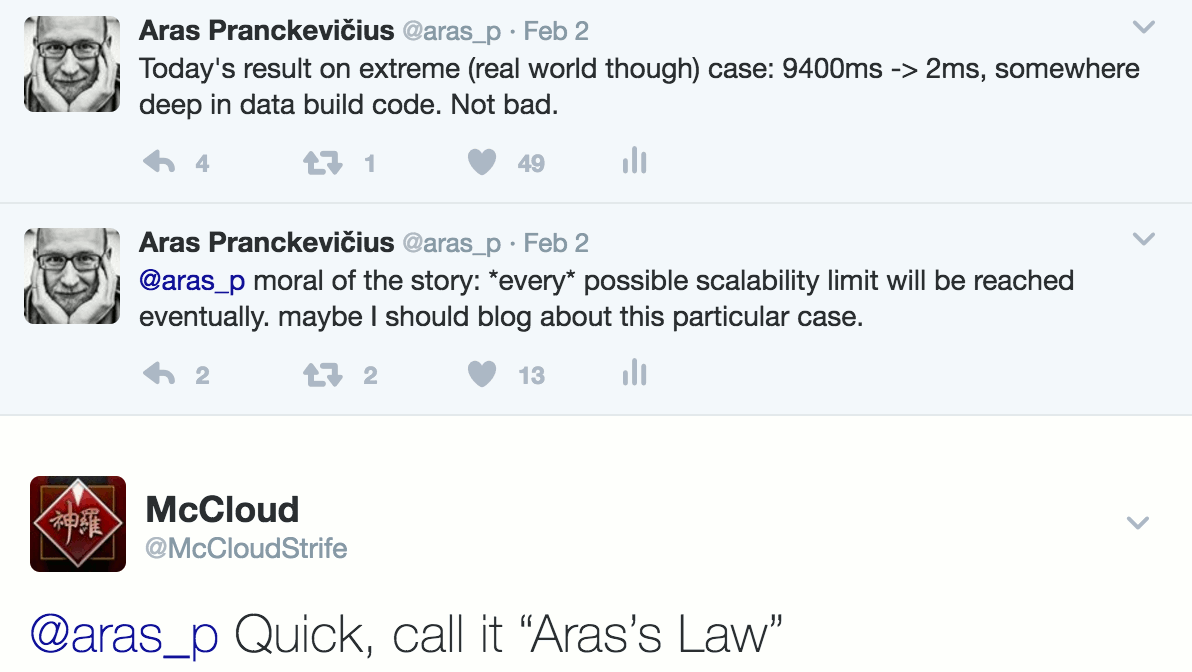
I keep on hearing that I should write more, but most of the time don’t feel like I have anything interesting to say. So I keep on posting random lame jokes and stuff on twitter instead.

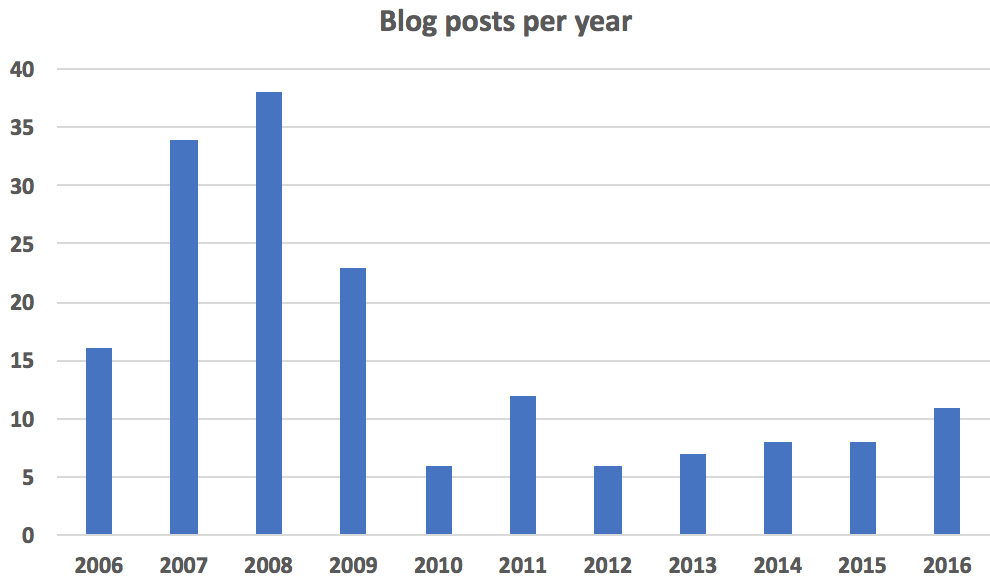
Nevertheless, the amount of blog posts has been very slowly rising. The drop starting around year 2009 very much coincides with me getting onto twitter. Will try to write more in 2017, but we’ll see how that goes. If you have ideas on what I should write about, let me know!

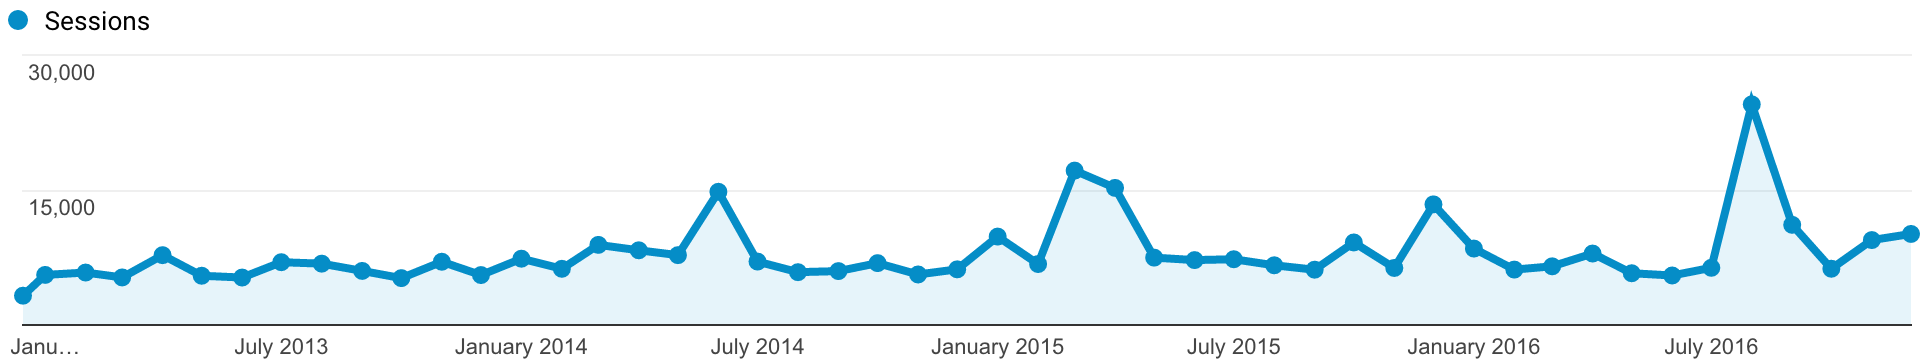
The amount of readers on the website is basically constant through all the time that I had analytics on it (starting 2013 or so). Which could mean it’s only web crawling bots that read it, for all I know :) There’s an occasional spike, pretty much only because someone posted link on either reddit or hackernews, and the hive mind there decided to pay attention to it for five minutes or whatever.

Giving Back

Financially, I live a very comfortable life now, and that is by no means just an “I made it all by myself” thing. Starting conditions, circumstances, family support, a ton of luck all helped massively.

I try to pay some of that back by sharing knowledge (writing the blog, speaking, answering questions on twitter andask.fm). This is something, but I could do more!

So this year started doing more of a “throw money towards good causes” thing too, compared to what I did before. Helped some local schools, and several local charities / help funds / patreons / “this is a good project” type of efforts. I’m super lucky that I can afford to do that, looking forward to doing more of it in 2017.

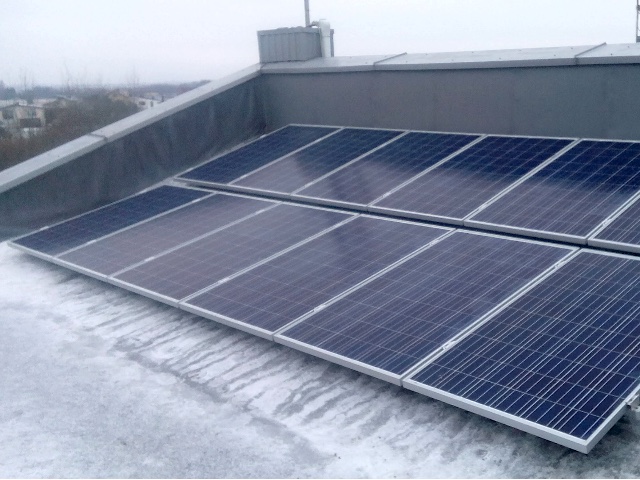
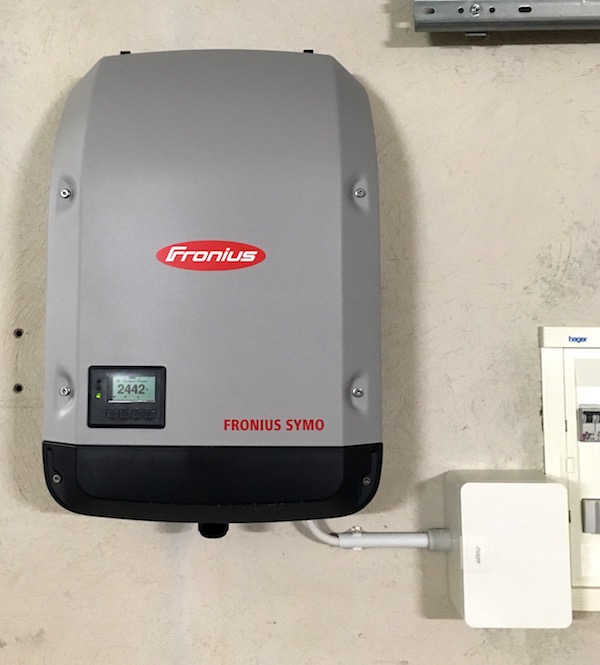
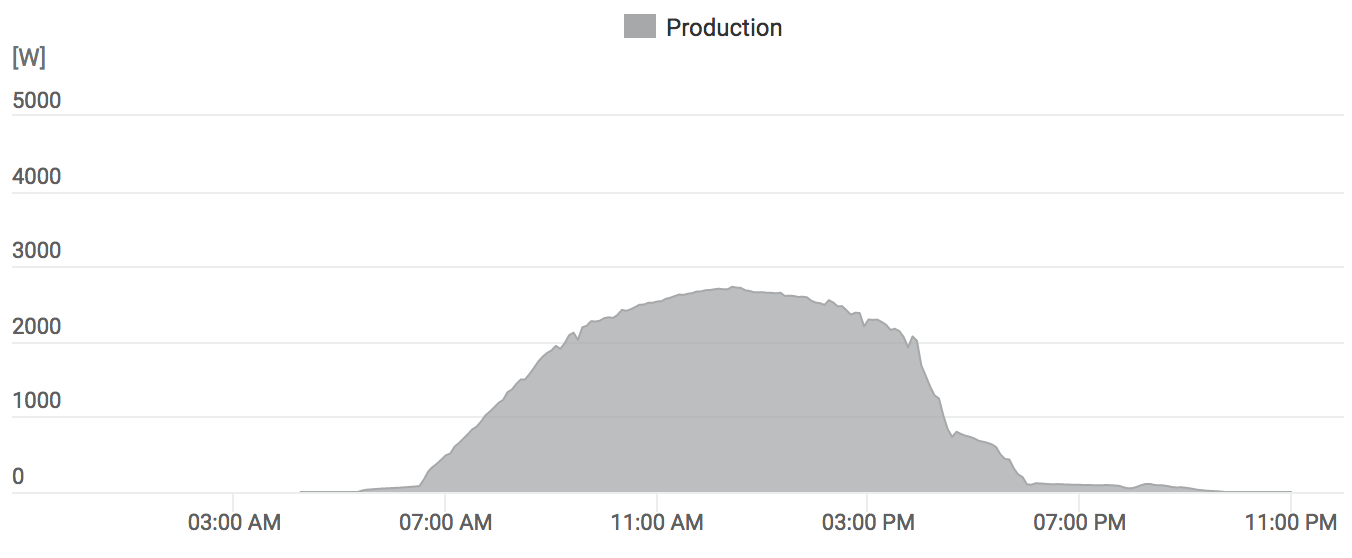
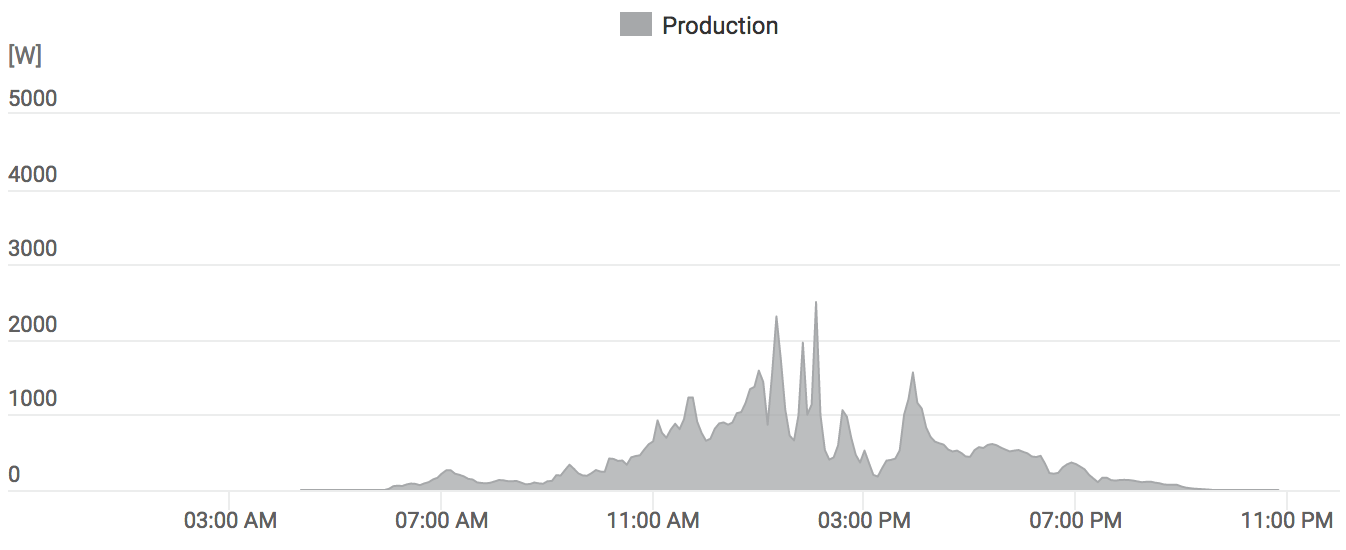
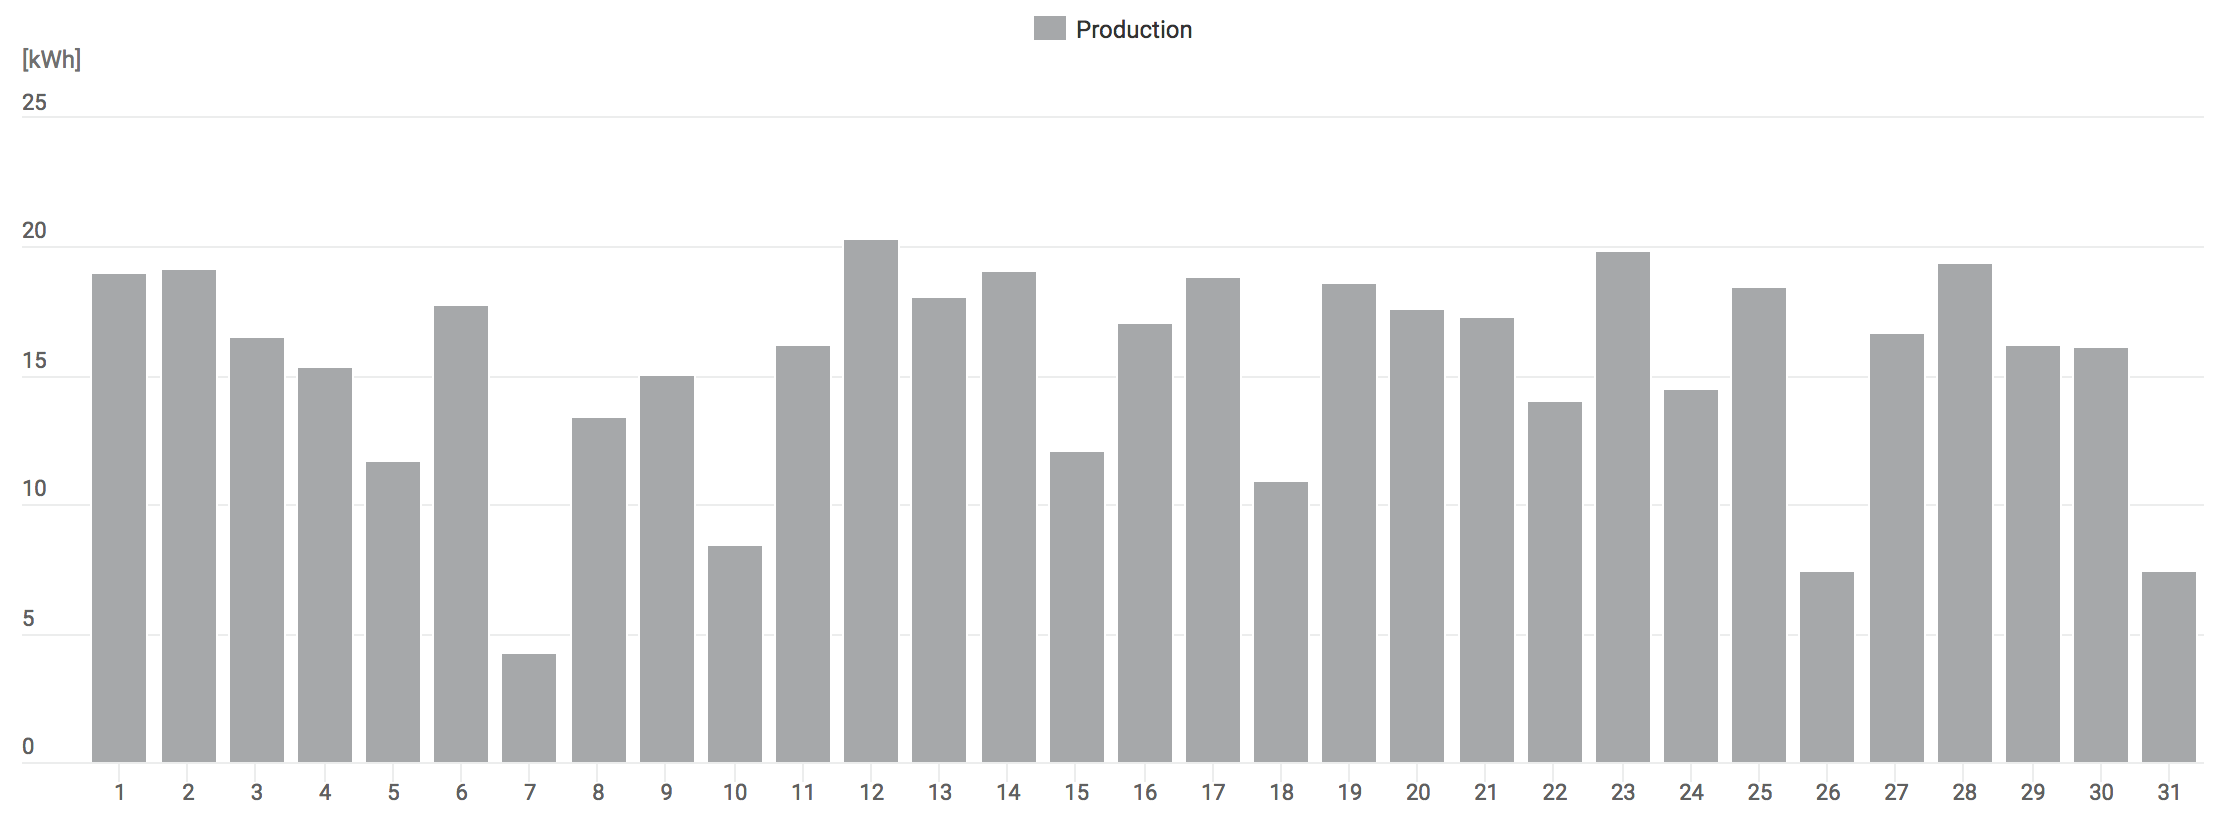
Started work towards installing solar panels on the roof, which should generate about as much electricity as we use up. That’s not exactly under “giving back” section, but feels good to have finally decided to do it. Will see how that goes in our (not that sunny) land.

Other Things

I’m not a twenty-something anymore, and turns out I have to do some sort of extra physical activity besides working with a computer all day long. But OMG it’s so boring, so it takes a massive effort to force myself to do it. I actually stopped going to the gym for half a year, but then my back pains said “ohai! long time no see!”. Ugggh. So towards end of 2016 started doing the gym thing again. I can only force myself to go there twice a week, but that’s enough to keep me from collapsing physically :) So far so good, but still boring.

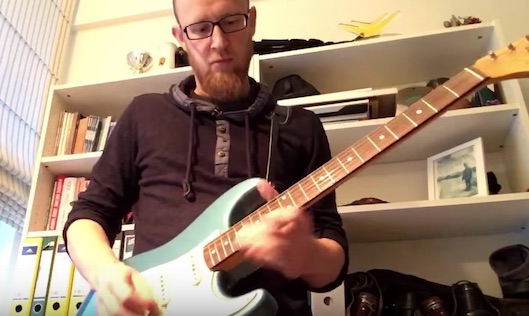
Rocksmith keeps on being the only “hobby” that I have, and still having loads of fun with it. I probably have played about 200 hours this year.

It feels like I am still improving my guitar playing skills, but I’m not doing enough effort to actually improve. Most of the time I just play through songs in a messy way, without taking time to go through difficult riffs or solos and really nail the things down. So my playing is like: eh, ¯\_(ツ)_/¯. Maybe in 2017 I should try playing with some other people (something I have never done, besides a few very lame attempts in high school), or try taking “real” guitar lessons.

INSIDE and Firewatch are my games of the year. They are both made with Unity too, which does not feel bad at all.

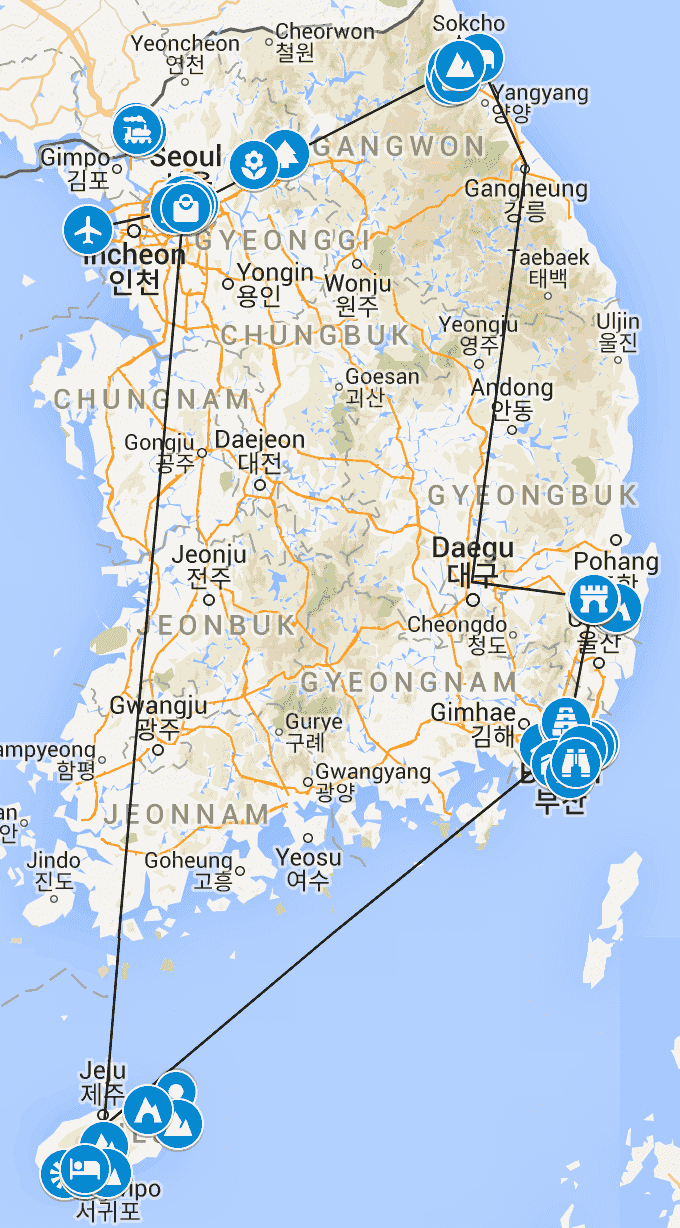
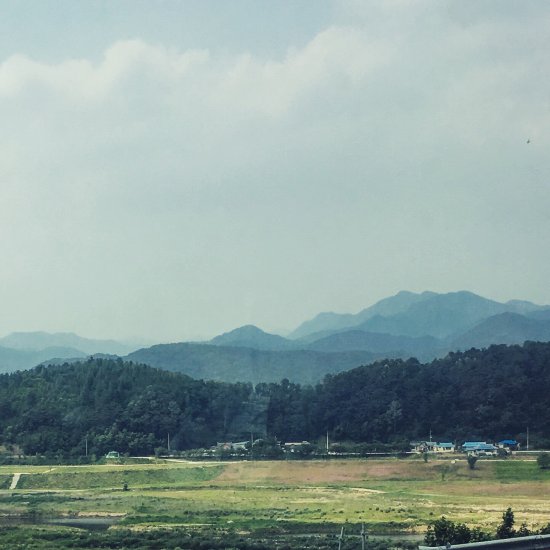
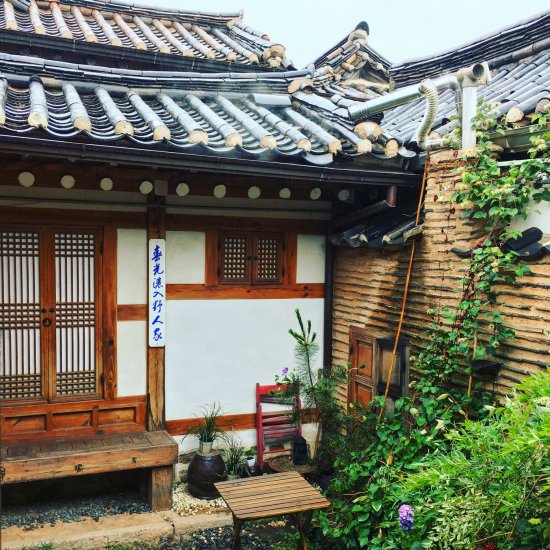
Did family vacations, lazy one in Maldives and a road trip in Spain. Both were nice in their own way, but we all (again) realized that lazy-type vacations are not our style, even if they are nice to have once in a while.

In 2017 I want to spend less time on social media, which lately is mostly a source of really depressing news, and just do more useful or helpful things instead. Wish me luck.


Chrome Tracing as Profiler Frontend

$
0
0

Did you know that Google Chrome has a built-in profiler? Some people assume it’s only for profiling “web stuff” like JavaScript execution. But it can also be used as a really nice frontend for your own profiling data.

Colt McAnlis actually wrote about using it for game profiling, in 2012:Using Chrome://tracing to view your inline profiling data. Everything written there still stands, and I’m mostly going to repeat the same things. Just to make this Chrome Tracing thing more widely known :)

Backstory

For a part of our code build system, we have a super simple profiler (called TinyProfiler) that captures scoped sections of the code and measures time spent in them. It was producing a simple HTML+SVG “report file” with a flame graph style visualization:

This gets the job done, but the resulting HTML is not very interactive. You can hover over things and have their time show up in the text box. But no real zooming, panning, search filtering or other niceties that one could expect from a decent profiler frontend UI.

All these things could be implemented… but also, why do that when someone else (Chrome) already wrote a really nice profiler UI?

Using Chrome Tracing

All that is needed to do to use Chrome Tracing view is:

  1. Produce a JSON file with the format expected by Chrome,
  2. Go to chrome://tracing in Chrome,
  3. Click “Load” and open your file, or alternatively drag the file into Chrome,
  4. Profit!

The final result looks pretty similar to our custom HTML+SVG thing, as Chrome is also visualizing the profiling data in the flame graph style:

Advantages of doing this:

  1. Much better profiling UI: zooming, panning, filtering, statistics, and so on.
  2. We no longer need to write profiler UI frontend (no matter how simple) ourselves.
  3. 500 lines of code less than what we had before (writing out the JSON file is much simpler than the SVG file).

And some potential disadvantages:

  1. No easy way to “double click report file to open it” as far as I can see. Chrome does not have any command line or automated interface to open itself, go to tracing view, and load a file all in one go. So you have to manually do that, which is more clicks.
    • This could be improved by producing HTML file with everything needed, by using trace2html tool from theChrome Tracing repository. However, that whole repository is ~1GB in size (it has way more stuff in it than just tracing UI), and I’m not too keen on adding a gigabyte of external dependency just for this. Maybe it would be possible to produce a “slimmed down, just the trace2html bits” version of that repository.
  2. Added dependency on 3rd party profiling frontend. However:

My take is that the advantages outweigh the disadvantages.

JSON file format

Trace Event Format is really nicely documented, so see there for details on more advanced usage. Basic structure of the JSON file is as follows:

{"traceEvents": [
{ "pid":1, "tid":1, "ts":87705, "dur":956189, "ph":"X", "name":"Jambase", "args":{ "ms":956.2 } },
{ "pid":1, "tid":1, "ts":128154, "dur":75867, "ph":"X", "name":"SyncTargets", "args":{ "ms":75.9 } },
{ "pid":1, "tid":1, "ts":546867, "dur":121564, "ph":"X", "name":"DoThings", "args":{ "ms":121.6 } }
],"meta_user": "aras","meta_cpu_count": "8"
}

traceEvents are the events that show up in the UI. Anything that is not recognized by the event format is treated as “metadata” that is shown by the UI metadata dialog (in this case, meta_user and meta_cpu_count are metadata). The JSON above looks like this in the Chrome Tracing UI:

Events described in it are the simplest ones, called “Complete Events” (indicated by ph:X). They need a timestamp and duration given in microseconds (ts and dur). The other fields are process ID and thread ID (pid and tid), and a name to display. There’s no need to indicate parent-child relationships between the events; the UI automatically figures that out based on event timings.

Events can also have custom data attached to them (args), which is displayed in the lower pane when an event is selected. One gotcha is that there has to be some custom data in order for the event to be selectable at all. So at least put some dummy data in there.

And basically that’s it for a super simple usage. Check outTrace Event Format for more advanced event types and usage. Happy profiling!

UI is hard, and other Typical Work Stories

$
0
0

Recently I’ve seen a mention that game engine programming is considered a mysterious, elite, and highly demanding type of work. So let me write up what often actually happens in day to day work. Also about how in many types of tasks, doing the UI is often the hardest one :)

Request: separate texture UV wrapping modes

I saw “could we have separate wrap modes for texture U and V axes?” being requested on the internets. This is not new; we had actually discussed this same thing internally just a few weeks before.

Up until now, in Unity you could only specify one texture coordinate wrapping mode that would apply to both (or in volume texture case, all three) axes.

All the graphics APIs and and GPUs I’ve seen do support separate UV(W) wrap modes, and while it’s not a common use case, there are valid cases where that is useful to have. For example, when using Lat-Long environment maps for reflection probes, it is useful to have Clamp on vertical texture coordinate, but Repeat on the horizontal coordinate (why use lat-long environment maps? because some platforms don’t support cubemap arrays, and yeah I’m looking at you mobile platforms).

So I thought I’d do it as part of Mondays are for Mandatory Fun™ thing we have:

How hard could this possibly be?

The change itself is trivial. Instead of having one wrap mode in a sampler descriptor” we need to have three, and set them up to the graphics API acoordingly. Actual platform specific change looks something like this (Metal here, but very similar for any other API). Somewhere where the sampler state is created or set up:

“Oh, but Unity supports, I don’t know, three million graphics APIs? That’s gonna be hard to do?”– turns out, not really. At the time of writing, I had to add code to 11 “platform API abstraction” implementations. Eleven is more than one or two, but doing all that was trivial enough. Even without having compilers/SDKs for at least half of them :)

Real amount of work starts to appear once you try to write down what are “all the things” that need to be done. The “graphics API” bit is just one entry there!

Before doing a task like this, I look for whether that particular area is in a need of some small cleanup or refactor. In this case it was; we were passing all sampler state as separate arguments into platform abstraction functions, instead of something like a “sampler descriptor struct”. It was already cumbersome, and adding separate wrapping modes would not make it better. So first item on the list becomes, “refactor that”.

And then when doing actual changes, I’d keep on noticing “well this should be cleaned up” type of code too, and write that down to the end of the list. None of that is critical for the task at hand, but codebase cleanup does not happen by itself otherwise.

Most of the items on the list are easy enough though. Except… yeah, UI.

User Interface

Ok, so how do you show UI in texture settings for separate wrapping modes?

I looked at what others do, and for example UE4 just shows two dropdowns. This is trivial to implement, but did not feel “quite right”. Afterall, the expected 95% use case is that you’d want to use the same wrapping mode on all axes. Doing this would get you the feature/flexibility (yay!), but a fairly rarely used one that costs an extra row of setting controls, no matter whether you need it or not.

It should be possible to do better.

Try 1: extend wrap mode popup with more options

Today we only support Repeat and Clamp wrapping modes, and absolute majority of textures are non-volume textures. Which means extending to separate UV wrapping modes only needs to add two more entries into a single popup:

That is not too bad. For volume textures, there are three axes to worry about, so the popup becomes a choice of 8 possible options. This is more confusing, but maybe we can sweep it under a “hey this is a super rare case” rug.

A slightly bigger worry is that people are also asking for other coordinate wrapping modes that we have not exposed before (“border” and “mirror”). If/when we add them, the single popup would not be a good solution. The number of entries in in would become too large to be useful.

Try 2: per-axis popups, linked by default

You know that “these fields are linked” widget from image editors?

I thought maybe let’s do that; show one popup per-axis, but by default have them linked together. Here’s how it looks like (using “lock” icon to mean “linked”, because no one painted a proper icon yet):

And then it can be unlinked to select different wrapping modes. For volume textures, it would display three popups, but otherwise function the same.

This almost works fine. The downsides are:

  • Still additional visual noise in the settings even if you don’t use the feature, and
  • In the image editors, “linked” is mostly used for numeric input fields; linking dropdown controls together is not a familiar UI pattern.

Try 3: one popup with “Per-Axis” choice

Here’s another idea: keep one popup by default, but instead of it having just [Repeat, Clamp] options, make them [Repeat, Clamp, Per-axis]. When per-axis is selected, that rolls out two more popups underneath (or three more, for volume textures):

This one actually feels nice. Yay! And only took three attempts to get right.

Oh, and then some more fumbling around to nicely handle various cases of multiple textures being selected, them all possibly having different settings set.

Doing all that UI related work took me about twice as long as doing everything else combined (and that includes“changes to eleven graphics APIs”). Now of course, I’m not a UI programmer, but still. UI is hard.

That’s it!

So yeah. A super small feature, that ended up probably two full days of work. Majority of that: trying to decide how exactly to present two popup controls. Who would have thunk, eh.

Otherwise, pretty much trivial steps to get there. However this does end up with about a hundred files being changed.

…and that is how “mysterious engine programming” looks like :) Now of course there is plenty of really challenging, “cutting edge knowledge required” type of work, where juggling chainsaws would probably look easy in comparison. But, plenty of “nothing special, just work” type of items too.

Separate texture UV wrapping modes might be coming to a nearby Unity version soon-ish. Thanks to Alexey, Lukas, Shawn, Vlad for UI discussions & suggestions.

Every Possible Scalability Limit Will Be Reached

$
0
0

I wrote this the other day, and @McCloudStrife suggested I should call it “Aras’s law”. Ok! here it is:

Every possible scalability limit will be reached eventually.

Here’s a concrete example that I happened to work on a bit during the years: shader “combinatorial variant explosion” and dealing with it.

In retrospect, I should have skipped a few of these steps and recognized that each “oh we can do 10x more now” improvement won’t be enough when people will start doing 100x more. Oh well, live and learn. So here’s the boring story.

Background: shader variants

GPU programming models up to this day still have not solved “how to compose pieces together” problem. In CPU land, you have function calls, and function pointers, and goto, and virtual functions, and more elaborate ways of “do this or that, based on this or that”. In shaders, most of that either does not exist at all, or is cumbersome to use, or is not terribly performant.

So many times, people resort to writing many slightly different “variants” of some shader, and pick one or another to use depending on what is being processed. This is called “ubershaders” or “megashders”, and often is done by stiching pieces of source code together, or by using a C-like preprocessor.

Things are slowly improving to move away from this madness (e.g. specialization constants in Vulkan, function constants in Metal), but it will take some time to get there.

So while we have the “shaders variants” as a thing, it can end up being a problem, especially if number of variants is large. Turns out, it can get large really easily!

Unity 1.x: almost no shader variants

Many years ago, shaders in Unity did not have many variants. They were only dealing with simple forward shading; you would write // autolight 7 in your shader, and that would compile into 5 internal variants. And that was it.

Why a compile directive behind a C++ style comment? Why 7? Why 5 variants? I don’t know, it was like that. 7 was probably the bitmask of which light types (three bits: directional, spot, point) to support, but I’m not sure if any other values besides“7” worked. Five variants, because some lights needed more to support light cookies vs. no light cookies.

Back then Unity supported just one graphics API (OpenGL), and five variants of a shader was not a problem. You can count them on your hand! They were compiled at shader import time, and all five were always included into the game data build.

Unity 2.x: add some more variants

Unity 2.0 changed the syntax into a #pragma multi_compile, so that it looks less of a commnt and more like a proper compile directive. And at some point it got the ability for users to add their own variants, which we called“shader keywords”. I forget which version exactly that happened in, but I think it was 2.x series.

Now people could make shaders do one or another thing of their choice (e.g. use a normalmap vs do not use a normal map), and control the behavior based on which “shader keywords” were set.

This was not a big problem, since:

  • There was no way to have custom inspector UIs for materials, so doing complex data-dependent shader variants was not practical,
  • We did not use the feature much in the Unity’s built-in shaders, so many thought of it as “something advanced, maybe not for me”,
  • All shader variants for all graphics APIs (at this time: OpenGL & Direct3D 9) were always compiled at shader import time, and always included into game build data.
  • I think there was a limit of maximum 32 shader keywords being used.

In any case, “crazy amount of shader variants” was not happening just yet.

Unity 3.x: add some more variants

Unity 3 added built-in lightmapping support (which meant more shader varinants: with & without lightmaps), and added deferred lighting too (again more shader variants). The game build pipeline got ability to not include some of the “well this surely won’t be needed” shader variants into the game data. But compilation of all variants present in the shader was still happening at shader import time, making it impractical to go above couple dozen variants. Maybe up to a hundred, if they are simple enough each.

Unity 4.x: things are getting out of hand! New import pipeline

Little by little, people started adding more and more shader variants. I think it was Marmoset Skyshop that gave us the “wow something needs to be done” realization, either in 2012 or 2013.

The thing with many shader-variant based systems is: number of possible shader variants is always much, much higher than the number of actually used shader variants. Imagine a simple shader that has these things in a multi-variant fashion:

  • Normal map: off / on
  • Specular map: off / on
  • Emission map: off / on
  • Detail map: off / on
  • Alpha cutout: off / on

Now, each of the features above essentially is a bit with two states; there are 5 features so in total there are 32 possible shader variants (2^5). How many will actually be used? Likely a lot less; a particular production usually settles for some standard way of authoring their materials. For example, most materials will end up using a normal map and specular map; with occasional one also putting in either an emission map or alpha cutout feature. That’s a handful of shader variants that are needed, instead of full set of 32.

But up to this point, we were compiling each and every possible shader variant at shader import time! It’s not terribad if there’s 32 of them, but some people wanted to have ten or more of these “toggleable features”. 2^N gets to a really large number, really fast.

It also did not help that by then, we did not only have OpenGL & Direct3D 9 graphics APIs; there also was Direct3D 11, OpenGL ES, PS3, Xbox360, Flash Stage3D etc. We were compiling all variants of a shader into all these backends at import time! Even if you never ever needed the result of that :(

So @robertcupisz and myself started rewriting the shader compilation pipeline. I have written about it before: Shader compilation in Unity 4.5. It basically changed several things:

  • Shader variants would be compiled on-demand (whenever needed by editor itself; or for game data build) and cached,
  • Shader compiler was split into a separate process per CPU core, to work around global mutexes in some shader compiler backends; these were preventing effictive multithreading.

This was a big improvement compared to previous state. But are we done yet? Far from it.

Unity 5.0: need to make some variants optional

The new compilation pipeline meant that editing a shader with a thousand potential variants was no longer a coffee break. However, all 1000 variants were still always included into the build. For Unity 5 launch we were developing a new built-inStandard shader with 20000 or so possible variants, and always including all of them was a problem.

So we added a way to indicate that “you know, only include these variants if some materials use them” when authoring a shader. Variants that were never used by anything were:

  1. never even compiled and
  2. not included into the game build either.

That was done in 2013 December, with plenty of time to ship in Unity 5.0.

During that time other people started “going crazy” with shader variant counts too – e.g. Alloy shaders were about 2 million variants. So we needed some more optimizations that Iwrote about before, that managed to get just in time for Unity 5 launch.

So we went from “five variants” to “two million possible variants” by now… Is that the limit? Are we there yet? Not quite!

Unity 5.4: people need more shader keywords

Sometime along the way amount of shader keywords (the “toggleable shader features that control which variant is picked”) that we support went from 32 up to 64, then up to 128. That was still not enough, as you can see from thislong forum thread.

So I looked at increasing the keyword count to 256. Turns out, it was doable, especially after fiddling around with some hash functions. Side effect of investigating various hash functions: replaced almost all hash functions used across the whole codebase \o/.

Ok this by itself does neither improve scalability of shader variant parts, nor makes it worse… Except that with more shader keywords, people started adding even more potential shader variants! Give someone a thing, and they will start using it in both expected and unexpected ways.

Are we there yet? Nope, still a few possible scalability cliffs in near future.

Unity 5.5: we are up to 70 million variants now, or “don’t expand that data”

Our own team working on the new “HD Render Pipeline” had shaders with about 70 million of possible variants by now.

Turns out, there was a step where in the editor, we were still expanding some data for all possible variants into some in-memory structures. At 70 million potential variants, that was taking gobs of memory, and a lot of time was spent searching through that.

Time to fix that! Stop expanding that data, instead search directly from a fairly compact “unexpanded” data. That unblocked the team; import time from doing a minor shader edit went from “a minute” to “a couple seconds”.

Yay! For a while.

Unity 5.6: half a billion variants anyone? or “don’t search that data”

Of course they went up to half a billion possible variants, and another problem surfaced: in some paths in the editor, when it was looking for “okay so which shader variant I should use right now?”, the code was enumerating all possible variants and checking which one is “closest to what we want”. In Unity, shader keywords do not have to exactly match some variant present in the shader, for better or worse… Previous step made it so that the table of “all possible variants” is not expanded in memory. But purely enumerating half a billion variants and doing fairly simple checks for each was still taking a long time! “Half a billion” turns out to be a big number.

Now of course, doing a search like that is fairly stupid. If we know we are searching for a shader variant with a keyword “NORMALMAP_ON” in it, there’s very little use in enumerating all the ones that do not have it. Each keyword cuts the search space in half! So that optimization was done, and nicely got some timings from “dozens of seconds” to “feels instant”. For that case when you have half a billion shader variants, that is :)

We are done now, right?

Now: can I have hundred billion variants? or “dont’ search that other data”

Somehow the team ended up with a shader that has almost a hundred billion of possible variants. How? Don’t ask; my guess is by adding everything and the kitchen sink to it. From a quick look, it is “layered lit + tessellation” shader, and it seems to have:

  • Usual optional textures: normal map, specular map, emissive map, detail map, detail mask map.
  • One, two, three or four “layers” of the maps, mixed together.
  • Mixing based on vertex colors, or height, or something else.
  • Tessellation: displacement, Phong + displacement, parallax occlusion mapping.
  • Several double sided lighting modes.
  • Transparency and alpha cutout options.
  • Lightmapping options.
  • A few other oddball things.

The thing is, you “only” need about 36 of individually toggleable features to get to a hundred billion variant range (2^36=69B). 36 features is a lot of features, but imaginable.

The problem they ran into, was that at game data build time, the code was, similar to the previous case, looping over all possible shader variants and deciding whether each one should be included into the data file or not. Looping over a hundred billion simple things is a long process! So they were like “oh we wanted to do a build to check performance on a console, but gave up waiting”. Not good!

And of course it’s a stupid thing to do. The loop should be inverted, since we already have the info about which materials are included into the game build, and from there know which shader variants are needed. We just need to augment that set with variants that“always have to be in the build”, and that’s it. That got the build time from “forever” down to ten seconds.

Are we done yet? I don’t know. We’ll see what the future will bring :)

Moral of the story is: code that used to do something with five things years ago might turn out to be problematic when it has to deal with a hundred. And then a thousand. And a million. And a hundred billion. Kinda obvious, isn’t it?

Font Rendering is Getting Interesting

$
0
0

Caveat: I know nothing about font rendering! But looking at the internets, it feels like things are getting interesting. I had exactly the same outsider impression watching some discussions unfold between Yann Collet, Fabian Giesen and Charles Bloom a few years ago – and out of that came rANS/tANS/FSE, and Oodle and Zstandard. Things were super exciting in compression world! My guess is that about “right now” things are getting exciting in font rendering world too.

Ye Olde CPU Font Rasterization

A true and tried method of rendering fonts is doing rasterization on the CPU, caching the result (of glyphs, glyph sequences, full words or at some other granularity) into bitmaps or textures, and then rendering them somewhere on the screen.

FreeType library for font parsing and rasterization has existed since “forever”, as well as operating system specific ways of rasterizing glyphs into bitmaps. Some parts of the hinting process have been patented, leading to “fonts on Linux look bad” impressions in the old days (my understanding is that all these expired around year 2010, so it’s all good now). And subpixel optimized rendering happened at some point too, which slightly complicates the whole thing. There’s a good overview of the whole thing in 2007 Texts Rasterization Exposures article by Maxim Shemanarev.

In addition to FreeType, these font libraries are worth looking into:

  • stb_truetype.h– single file C library by Sean Barrett. Super easy to integrate! Article on how the innards of the rasterizer work is here.
  • font-rs– fast font renderer by Raph Levien, written in Rust \o/, andan article describing some aspects of it. Not sure how “production ready” it is though.

But at the core the whole idea is still rasterizing glyphs into bitmaps at a specific point size and caching the result somehow.

Caching rasterized glyphs into bitmaps works well enough. If you don’t do a lot of different font sizes. Or very large font sizes. Or large amounts of glyphs (as happens in many non-Latin-like languages) coupled with different/large font sizes.

One bitmap for varying sizes? Signed distance fields!

A 2007 paper from Chris Green,Improved Alpha-Tested Magnification for Vector Textures and Special Effects, introduced game development world to the concept of “signed distance field textures for vector-like stuffs”.

The paper was mostly about solving “signs and markings are hard in games” problem, and the idea is pretty clever. Instead of storing rasterized shape in a texture, store a special texture where each pixel represents distance to the closest shape edge. When rendering with that texture, a pixel shader can do simple alpha discard, or more complex treatments on the distance value to get anti-aliasing, outlines, etc. The SDF texture can end up really small, and still be able to decently represent high resolution line art. Nice!

Then of course people realized that hey, the same approach could work for font rendering too! Suddenly, rendering smooth glyphs at super large font sizes does not mean “I just used up all my (V)RAM for the cached textures”; the cached SDFs of the glyphs can remain fairly small, while providing nice edges at large sizes.

Of course the SDF approach is not without some downsides:

  • Computing the SDF is not trivially cheap. While for most western languages you could pre-cache all possible glyphs off-line into a SDF texture atlas, for other languages that’s not practical due to sheer amount of glyphs possible.
  • Simple SDF has artifacts near more complex intersections or corners, since it only stores a single distance to closest edge. Look at the letter A here, with a 32x32 SDF texture - outer corners are not sharp, and inner corners have artifacts.
  • SDF does not quite work at very small font sizes, for a similar reason. There it’s probably better to just rasterize the glyph into a regular bitmap.

Anyway, SDFs are a nice idea. For some examples or implementations, could look atlibgdx orTextMeshPro.

The original paper hinted at the idea of storing multiple distances to solve the SDF sharp corners problem, and a recent implementation of that idea is “multi-channel distance field” by Viktor Chlumský which seems to be pretty nice: msdfgen. See associatedthesis too. Here’s letter A as a MSDF, at even smaller size than before – the corners are sharp now!

That is pretty good. I guess the “tiny font sizes” and “cost of computing the (M)SDF” can still be problems though.

Fonts directly on the GPU?

One obvious question is, “why do this caching into bitmaps at all? can’t the GPU just render the glyphs directly?” The question is good. The answer is not necessarily simple though ;)

GPUs are not ideally suited for doing vector rendering. They are mostly rasterizers, mostly deal with triangles, etc etc. Even something simple like “draw thick lines” is pretty hard (great post on that – Drawing Lines is Hard). For more involved “vector / curve rendering”, take a look at a random sampling of resources:

That stuff is not easy! But of course that did not stop people from trying. Good!

Vector Textures

Here’s one approach, GPU text rendering with vector textures by Will Dobbie - divides glyph area into rectangles, stores which curves intersect it, and evaluates coverage from said curves in a pixel shader.

Pretty neat! However, seems that it does not solve “very small font sizes” problem (aliasing), has limit on glyph complexity (number of curve segments per cell) and has some robustness issues.

Glyphy

Another one is Glyphy, by Behdad Esfahbod (بهداد اسفهبد). There’s video and slides of the talk about it. Seems that it approximates Bézier curves with circular arcs, puts them into textures, stores indices of some closest arcs in a grid, and evaluates distance to them in a pixel shader. Kind of a blend between SDF approach and vector textures approach. Seems that it also suffers from robustness issues in some cases though.

Pathfinder

A new one is Pathfinder, a Rust (again!) library by Patrick Walton. Nice overview of it in this blog post.

This looks promising!

Downsides, from a quick look, is dependence on GPU features that some platforms (mobile…) might not have – tessellation / geometry shaders / compute shaders (not a problem on PC). Memory for the coverage buffer, and geometry complexity depending on the font curve complexity.

Hints at future on twitterverse

From game developers/middleware space, looks like Sean Barrett and Eric Lengyel are independently working on some sort of GPU-powered font/glyph rasterization approaches, as seen by their tweets (Sean’s andEric’s).

Can’t wait to see what they are cooking!

Did I say this is all very exciting? It totally is. Here’s to clever new approaches to font rendering happening in 2017!


Some figures in this post are taken from papers or pages I linked to above:

Stopping graphics, going to build engineering

$
0
0

I’m doing a sideways career move. Which is: stopping whatever graphics related programming I was doing, and start working on internal build engineering. Been somewhat removing myself from many graphics related areas (ownership, code reviews, future tasks, decisions & discussions) for a while now, and right now GDC provides a conceptual break between graphics and non-graphics work areas.

Also, I can go into every graphics related GDC talk, sit there at the back and shout “booo, graphics sucks!” or something.

“But why?” - several reasons, with major one being “why not?”. In random order:

  • I wanted to “change something” for a while, and this does qualify as that. I was mostly doing graphics relate things for what, 11 years by now at the same company? That’s a long time!
  • I wanted to try myself in an area where I’m a complete newbie, and have to learn everything from scratch. In graphics, while I’m nowhere near being “leading edge” or having actual knowledge, at least I have a pretty good mental picture of current problems, solutions, approaches and what is generally going on out there. And I know the buzzwords! In build systems, I’m Jon Snow. I want to find out how that is and how to deal with it.
  • This one’s a bit counter-intuitive… but I wanted to work in an area where there are three hundred customers instead of five million (or whatever is the latest number). Having an extremely widely used product is often inspiring, but also can be tiring at times.
  • Improving ease of use, robustness, reliability and performance of our own internal build system(s) does sound like a useful job! It’s something all the developers here do many times per day, and there’s no shortage of improvements to do.
  • Graphics teams at Unity right now are in better state than ever before, with good structure, teamwork, plans and efficiency in place. So me leaving them is not a big deal at all.
  • The build systems / internal developer tooling team did happen to be looking for some helping hands at the time. Now, they probably don’t know what they signed up for by accepting me… but we’ll see :)

I’m at GDC right now, and was looking for relevant talks about build/content/data pipelines. There are a couple, but actually not as much as I hoped for… That’s a shame! For example last yearRémi Quenin’s talk onFar Cry 4 pipeline was amazing.

What will my daily work be about, I still have no good idea. I suspect it will be things like:

  • Working on our own build system (we were on JamPlus for a long time, and replacing pieces of it).
  • Improving reliability of build scripts / rules.
  • Optimizing build times for local developer machines, both for full builds as well as incremental builds.
  • Optimizing build times for the build farm.
  • Fixing annoyances in current builds (there’s plenty of random ones, e.g. if you build a 32 bit version of something, it’s not easy to build 64 bit version without wiping out some artifacts in between).
  • Improving build related IDE experiences (project generation, etc.).

Anyhoo, so that’s it. I expect future blog posts here might be build systems related.

Now, build all the things! Picture unrelated.

Developer Tooling, a week in

$
0
0

So I switched job role from graphics todeveloper tooling / build engineering about 10 days ago. You won’t believe what happened next! Click to find out!

Quitting Graphics

I wrote about the change right before GDC on purpose - wanted to see reactions from people I know. Most of them were along what I expected, going around “build systems? why?!” theme (my answer: between “why not” and ¯\_(ツ)_/¯). I went to the gathering of rendering people one evening, and the “what are you doing here, you’re no longer graphics” joke that everyone was doing was funny at first, but I gotta say it to you guys: hearing it 40 times over is not that exciting.

At work, I left all the graphics related Slack channels (a lot of them), and wow the sense of freedom feels good. I think the number of Slack messages I do per week should go down from a thousand to a hundred or so; big improvement (for me, anyway).

A pleasant surprise: me doing that and stopping to answer the questions, doing graphics related code reviews and writing graphics code did not set the world on fire! Which means that my “importance” in that area was totally imaginary, both in my & in some other people’s heads. Awesome! Maybe some years ago that would have bothered me, but I think I’m past the need of wanting to“feel important”.

Not being important is liberating. Highly recommended!

Though I have stopped doing graphics related work at work, I am still kinda following various graphics research & advances happening in the world overall.

Developer Tooling

The “developer tools” team that I joined is six people today, and the “mission” is various internal tools that the rest of R&D uses. Mostly the code build system, but also parts of version control, systems for handing 3rd party software packages, various helper tools (e.g. Slack bots), and random other things (e.g. “upgrade from VS2010 to VS2015/2017” that is happening as we speak).

So far I’ve been in the build system land. Some of the things I noticed:

  • Wow it’s super easy to save hundreds of milliseconds from build time. This is not a big deal for a clean build (if it takes 20 minutes, for example), but for an incremental build add 100s of milliseconds enough times and we’re talking some real “developer flow” improvements. Nice!
  • Turns out, a lot of things are outdated or obsolete in the build scripts or the dependency graph. Here, we are generating some config headers for the web player deployment (but we have dropped web player a long time ago). There, we are always building this small little tool, that turns out is not used by anything whatsoever. Over here, tons of build graph setup done for platforms we no longer support. Or this often changing auto-generated header file, is included into way too many source files. And so on and so forth.
  • There’s plenty of little annoyances that everyone has about the build process or IDE integrations. None of them are blocking anyone, and very often do not get fixed. However I think they add up, and that leads to developers being much less happy than they could be.
  • Having an actual, statically typed, language for the build scripts is really nice. Which brings me to the next point…

C#

Our build scripts today are written in C#. At this very moment, it’s this strange beast we call “JamSharp” (primarily work of @lucasmeijer). It is JamPlus, but with an embedded .NET runtime (Mono), and so the build scripts and rules are written in C# instead of the not-very-pleasant Jam language.

Once the dependency graph is constructed, today it is still executed by Jam itself, but we are in the process of replacing it with our own, C# based build graph execution engine.

Anyway. C# is really nice!

I was supposed to kinda know this already, but I only occasionally dabbled in C# before, with most of my work being in C++.

In a week I’ve learned these things:

  • JetBrains Rider is a really nice IDE, especially on a Mac where the likes of VisualStudio + Resharper do not exist.
  • Most of C# 6 additions are not rocket surgery, but make things so much nicer. Auto-properties, expression bodies on properties, “using static”, string interpolation are all under “syntax sugar” category, but each of them makes things just a little bit nicer. Small “quality of life” improvements is what I like a lot.
  • Perhaps this is a sign of me getting old, but e.g. if I look at new features added to C++ versions, my reaction to most of them is “okay this probably makes sense, but also makes my head spin. such. complexity.“. Whereas with C# 6 (and7 too), almost all of them are “oh, sweet!”.

So how are things?

One week in, pretty good! Got a very vague grasp of the area & the problem. Learned a few neat things about C#. Did already land two pull requests to mainline (small improvements andwarning fixes), with anotherimprovements batch waiting for code reviews. Spent two days in Copenhagen discussing/planning next few months of work and talking to people.

Is very nice!

A case of slow Visual Studio project open times

$
0
0

I was working on some new code to generate Visual Studio solution/project files, and that means regenerating the files and checking them in VS a lot of times. And each time, it felt like VS takes ages to reopen them! This is with Visual Studio 2017, which presumably is super-turbo optimized in project open performance, compared to previous versions.

The VS solution I’m working on has three projects, with about 5000 source files in each, grouped into 500 folders (“filters” as VS calls them) to reflect hierarchy on disk. Typical stuff.

On my Core i7-5820K 3.3GHz machine VS2017 takes 45 seconds to open that solution first time after rebuilding it, and about 20 seconds each time I open it later.

That’s not fast at all! What is going on?!

Time for some profiling

Very much like in the “slow texture importing” blog post, I fired up windows performance recorder, and recorded everything interesting that’s going on while VS was busy opening up the solution file.

Predictably enough, VS (devenv.exe) is busy during most of the time of solution load:

Let’s dig into the heaviest call stacks during this busy period. Where will this puppy with 16k samples lead to?

First it leads us through the layers of calls, which is fairly common in software. It’s like an onion; with a lot of layers. And you cry as you peel them off :)

So that is Visual Studio, seemingly processing windows messages, into some thread dispatcher, getting into some UI background task scheduler, and into some async notifications helper. We are 20 stack frames in, and did not get anywhere so far, besides losing some profiling samples along the way. Where to next?

A-ha! Further down, it is something from JetBrains. I do haveReSharper (2016.3.2) installed in my VS… Could it be that R# being present causes the slow project load times (at least in VS2017 with R# 2016.3)? Let’s keep on digging for a bit!

One branch of heavy things under that stack frame leads into something called CVCArchy::GetCfgNames, which, I guess, is getting the build configurations available in the project or solution. Internally it’s another onion, getting into marshaling and into some immutable dictionaries and concurrent stacks.

And another call branch goes into CVCArchy::GetPlatformNames, which seemingly goes into exactly the same implementation again. ¯\_(ツ)_/¯

So it would seem that two things are going on: 1) possibly R# is querying project configurations/platformsa lot of times (once for each file?), and 2) querying that from VS is actually a fairly costly operation.

VS seemingly tries to fulfill these “what configurations do you have, matey?” queries in an asynchronous fashion, since that also causes quite some activity on other VS threads. Hey at least it’s trying to help :)

Some of which causes not much actual work being done, e.g. this thread spends 1.5k samples doing spin waits. Likely an artifact of some generic thread work system not being quite used as it was intended to, or something.

There’s another background thread activity that kicks in towards end of the “I was busy opening the project” period. That one is probably some older code, since the call stack is not deep at all, and it fairly quickly gets to actual work that it tries to do :)

Let’s try with R# disabled

Disabling R# in VS 2017 makes it open the same solution in 8 seconds (first time) and 4 seconds (subsequent opens). So that is pretty much five times faster.

Does this sound like something that should be fixed in R#, somehow? That’s my guess too, so here’s abug report I filed. Fingers crossed it will be fixed soon! They already responded on the bug report, so things are looking good.

(Edit: looks like this will be fixed inR# 2017.1, nice!)

Visual Studio 2015 does not seem to be affected; opening the same solution with R# enabled is about 8 seconds as well. So this could be Microsoft’s bug too, or an unintended consequence of some implementation change (e.g. “we made config queries async now”).

Complex software is complex, yo.

While at it: dotTrace profiler

Upon suggestion from JetBrains folks, I did a dotTrace capture of VS activity while it’s opening the solution. Turns out, it’s a pretty sweet C# profiler! It also pointed out to basically the same things, but has C# symbols in the callstacks, and a nice thread view and so on. Sweet!

So there. Profiling stuff is useful, and can answer questions like “why is this slow?”. Other news at eleven!


How does Visual Studio pick default config/platform?

$
0
0

Everyone using Visual Studio is probably familiar with these dropdowns, that contain build configurations (Debug/Release is typical) and platforms (Win32/x64 is typical):

When opening a fresh new solution (.sln) file, which ones does Visual Studio pick as default? The answer is more complex than the question is :)

After you have opened a solution and picked a config, it is stored in a hidden binary file (VS2010: {solutionname}.suo, VS2015: .vs/{solutionname}/v14/.suo) that contains various user-machine-specific settings, and should not be put into version control. However what I am interested is what is the default configuration/platform when you open a solution for the first time.

Default Platform

Platform names in VS solution can be arbitrary identifiers, however platform names defined in the project files have to match an installed compiler toolchain (e.g. Win32 and x64 are toolchain names for 32 and 64 bit Windows on Intel CPUs, respectively).

Turns out, default platform is first one from an alphabetically, case insensitive, sorted list of allsolution platforms.

This means if you have Win32 and x64 as the solution platforms, then 32 bit one will be the default. That probably explains why in recent VS versions (at least since 2015), the built-in project creation wizard started naming them as x86 and x64 instead – this conveniently makes x64 be default since it sorts first.

A note again, platform names in the project have to be from a predefined set; so they have to stay Win32 and x64 and so on. Even if you use VS for editing files in a makefile-type project that invokes compiler toolchains that VS does not even know about (e.g. WebGL – for that project, you still have to pick whether you want to name the platform as Win32 or x64).

Default Configuration

When you have Debug and Release configurations, VS picks Debug as the default one. What if you have more configurations, that are more complex names (e.g. we might want to have a Debug WithProfiler LumpedBuild)? Which one will be the default one?

So, a pop quiz time! If all projects in the solution end up having this set of configurations, which one will VS use by default?

Foo
Foo_Bar
Foo Bar
Alot
AlotOfBanjos
Alot Of Bees
Debug
Debug_Lumped
Debug_Baloney
DebugBaloney

You might have several guesses, and they all would make some sense:

  • Foo since it’s the first one in the solution file,
  • Alot since it’s the first one alphabetically (and hey that’s how VS chooses default platform),
  • Debug since VS probably has some built-in logic to pick “debug” first.

Of course all these guesses are wrong! Out of the list above, VS will pick Debug_Baloney as the default one. But why?!

The logic seems to be something like this (found in thisstackoverflow answer, except it needed an addition for the underscore case). Out of all configurations present:

  1. Sort them (almost) alphabetically, case insensitive,
  2. But put configs that start with debug before all others,
  3. Also config that is another one with a Whatever or _Whatever added, go before it. So A_B goes beforeA; Debug All goes before Debug (but DebugAll goes after Debug).
  4. And now pick the first one from the list!

I do hope there is a good explanation for this, and today VS team probably can’t change it because doing so would upset three bazillion existing projects that learned to accidentally or on purpose to depend on this.

However this means that today in our code I have to write things like this:

// We want to put spaces into default config of the 1st native program;
// see ConfigurationToVSName. Default configs in each programs might be
// separate sets, so e.g. in the editor there might be "debug_lump" and
// the standalone might only have a longer one "debug_lump_il2cpp", and
// if both were space-ified VS would pick "debug lump il2cpp" as default.
var defaultSolutionConfig = nativePrograms[0].ValidConfigurations.Default;
GenerateSolutionFile(nativePrograms, solutionGuid, projectGuids, defaultSolutionConfig);
GenerateHelperScripts();
foreach (var np in nativePrograms)
{
    GenerateProjectFile(np, projectGuids, defaultSolutionConfig);
    GenerateFiltersFile(np);
}

and this:

// Visual Studio has no way to indicate which configuration should be default
// in a freshly opened solution, but uses logic along the lines of
// http://stackoverflow.com/a/41445987 to pick default one:
//
// Out of all configurations present:
// 1. Sort them (almost) alphabetically, case insensitive,
// 2. But put configs that start with "debug" before all others,
// 3. Also config that is another one with a " Whatever" or "_Whatever" added,
//    go before it. So "A_B" goes before "A"; "Debug All" goes before "Debug"
//    (but "DebugAll" goes after "Debug").
// 4. And now pick the first one from the list!
//
// Our build configs are generally underscore-separated things, e.g. "debug_lump_il2cpp".
// To make the default config be the first one, replace underscores in it with
// spaces; that will make it sort before other things (since space is before
// underscore in ascii), as long as it starts with "debug" name.
string ConfigurationToVSName(CApplicationConfig config, CApplicationConfig defaultConfig)
{
    if (config.IdentifierNoPlatform != defaultConfig.IdentifierNoPlatform)
        return config.IdentifierNoPlatform;
    return config.IdentifierNoPlatform.Replace('_', ' ');
}

This is all trivial code of course, but figuring out the logic for what VS ends up doing did took some experimentation. Oh well, now I know! And you know too, even if you never wanted to know :)

And voilà, debug_lump is picked by VS as the default in our auto-generated project files, which is what I wanted here. Without any extra logic, it was picking debug_lump_dev_il2cpp since that sorts before debug_lump as per rules above.

That’s it for now!

User's POV and Empathy

$
0
0

Recently someone at work said “hey Aras, you write great feature overview docs, what are the tips & tricks to do them” and that got me thinking… The only obvious one I have is:

Imagine what a user would want to know about {your thing}, and write it down.

I had some more detail in there, e.g. when writing a feature overview or “proposal for a thing”, write down:

  1. How do things work right now, what are current workflows of achieving this and what are the problems with it.
  2. How will this new feature solve those problems or help in other ways.
  3. Write down what a user would need to know. Including use-cases, examples and limitations.

Now, that is simple enough. But looking at a bunch of initial docs, release notes, error messages, UI labels and other user-facing things, both at Unity and elsewhere, it’s presumably not that obvious to everyone :)

Random Examples

Release Notes

Mercurial DVCS used to have release notes that were incomprehensible (to me as a user at least). For example here, take a look athg 3.4 notes. What does“files: use ctx object to access dirstate” or “dirstate: fix order of initializing nf vs f” mean? Are these even words?!

Even git, which I think is a somewhat Actively Hostile To The User(*) version control system, had better release notes. Check out git2.12.0 notes for example.

(*) I know, “Yeah, well, that’s just, like, your opinion, man” etc.

Thankfully, since Mercurial 3.7 they started writing “feature overview“ pages for each release, which helps a lot to point out major items in actual human language. Now I can read it and go “oh this looks sweet, I should upgrade” instead of “I know the words, but the sentences don’t mean anything. Eh, whatever!”.

Yes, this does mean that you can’t just dump a sorted list of all source control commit messages and call them release notes. Someone has to sit down and write an overview. However, your users will thank you for that!

Pull Requests

A pull request or a code review request asks other people to look at your code. They have to spend their time doing that! Time they could perhaps spend doing something else. If you can spend five minutes making their job easier, that is often very much worth it.

I used to review a lot of code in 2015/2016 (~20 PRs each week), and the “ugghhh, not this again” reaction was whenever I saw pull requests like this. In each case, that single sentence is the only thing in PR description, with no further info besides list of commits & code diff:

  • “Updates to 2D framework + all new animation window full of win”. 374 commits, 100 files changed, 8000 lines of code.
  • “Latest MT rendering work”. 64 commits, 95 files, 3000 lines of code.
  • “Multithreaded rendering refactor”. 119 commits, 79 files, 4000 lines of code.
  • “UWP Support”. 224 commits, 219 files, 7000 lines of code.
  • “Graphics jobs (preliminary)”. 114 commits, 112 files, 2000 lines of code.

Seriously. You just spent several months doing all that work, and have one sentence to describe it?!

Sometimes just a list of commit messages is enough to describe pull request contents for the reviewers (this is mostly true for PRs that are a bunch of independent fixes; with one commit per fix). If that is the case, say that in the PR description! The above list of PR examples were very much not this case though :)

What would be good PR descriptions that make reviewer’s job significantly easier? Here’s some good ones I’ve seen:

How do you make more PRs have good descriptions?

Often I would go and poke PR authors asking for the description, especially for large ones. Something like“Wow this is a big PR! Can you write up a summary of changes in the description; would make reviewing it much easier”.

Another thing we did was make our pull request tool pre-fill the PR description field:

Purpose of this PR:

[Desc of feature/change. Links to screenshots, design docs, user docs, etc. Remember reviewers may be outside your team, and not know your feature/area that should be explained more.]

Testing status:

[Explanation of what’s tested, how tested and existing or new automation tests. Can include manual testing by self and/or QA. Specify test plans. Rarely acceptable to have no testing.]

Technical risk:

[Overall product level assessment of risk of change. Need technical risk & halo effect.]

Comments to reviewers:

[Info per person for what to focus on, or historical info to understand who have previously reviewed and coverage. Help them get context.]

This simple change had a massive impact on quality of PR descriptions. Reviewers are now more happy and less grumpy!

Commit Messages and Code Comments

A while ago I was looking at some screen resolution handling code, and noticed that some sequence of operations was done in a different order on DX11 compared to DX9 or OpenGL. Started to wonder why, turns out I myself have changed it to be different… five years ago… with a commit message that says “fixed resolution switches” (100 lines of code changed).

Bad Aras, no cookie!

Five years later (of heck, even a few months later) you yourself will not remember what case exactly this was fixing. Either add that info into the commit message, or write down comments on tricky parts of code. Or both.Especially in code that is known to be hard to get right (and anything involving resolution switches on Windows is). Yes, sometimes it does make sense to write ten lines of comments for a single line of code. Future you, or your peers, or anyone who will look into this code will thank you for that.

I know that since I have had “pleasure” of maintaining my own code ten years later :) Cue “…and if you tell that to the young people today, they won’t believe you…” quote.

Any time someone might be wondering “why is this done?” about a piece of code, write it down. My own code these days often has comments like:

// All "folders" in the solution are represented as "fake projects" too;
// with a special parent GUID and instead of pointing to vcxproj files they
// just point to their own names.
var foldersParentGuid = "2150E333-8FDC-42A3-9474-1A3956D46DE8";

or

// VS filters file needs filter elements to exist for the whole folder hierarchy
// (e.g. if we have "Editor\Platform\Windows", we need to have "Editor\Platform",
// and "Editor" too). Otherwise it will silently skip grouping files into filters
// and display them at the root.
var parentFolders = allFolders.SelectMany(f => f.RecursiveParents).Where(p => p.Depth > 0).ToArray();
allFolders.UnionWith(parentFolders);

// VS seems to load projects a bit faster if file/folder lists are sorted
var sortedFolders = allFolders.OrderBy(f => f); 

If anything else, I write these for future myself.

Empathy

What all the above has in common?

Empathy.

Putting yourself into position of the reader, user, colleague, future self, etc. What do they want to know? What makes their job/task/life easier?

Mikko Mononen once showed these amazing resources:

I’m not sure what conclusion I wanted to make, so, ehhh, that’s it. Read the resources above!

Solar Roof

$
0
0

I had some solar panels installed on my roof, so here’s a post with graphs & numbers & stuff!

TL;DR: should more or less cover my electricity usage; easy setup; more involved paperwork; cost about 5k€ (should get 30% of that back someday due to government incentives); expected ROI 10 years; panels themselves are less than half of the cost today.

Setup and Paperwork

Sometime this winter, I had a small array of 12 solar panels (about 20 square meters; 3.12kWp, “kWp” is maximum power rating in ideal conditions) setup on my roof. Besides the panels, a power inverter has to be set up (panels generate direct current). I had it slapped on a wall in my garage.

The setup was fairly impressive - basically one dude did it all by himself in six hours. Including getting the panels onto the roof. Efficient!

And then came the paperwork… That took about three months atVogon pace; every little piece of paper had to be signed in triplicate, sent in, sent back, queried, lost, found, subjected to public inquiry, lost again, and finally buried in soft peat for three months and recycled as firelighters. Ok it’s not that bad; most of the paper busywork was done by the company that is doing the solar setup (I just had to sign an occasional document). But still, the whole chain of “setting up solar roof requires 20 paperwork steps” means that all these execute in a completely serial fashion and take three months.

Which means I could only “turn on” the whole thing a month ago.

How does it work?

The setup I have is a two-way electricity accounting system, where whatever the panels generate I can use immediately. If I need more power (or the sun is not shining), I use more from the regular grid. If I happen to generate more than I need, the surplus goes back into the grid for “storage” that I can recoup later (during the night, or during winter etc.). I pay about 0.03€ for kWh stored that way (regular grid electricity price is about 0.11€); the grid essentially works as a battery.

A two-way meter is setup by the energy company that tracks both the power used & power given back to the grid.

This setup is fairly new here in Lithuania; they only started doing this a couple years ago. I’ve no idea how it is in other countries; you’ll have to figure that out yourself!

Show me the graphs!

On a bright sunny day, the solar production graph almost follows the expected dot(N,L) curve :)

It generated a total of 21.4 kWh on that day. On a very cloudy/rainy day, the graph looks like this though (total 7.5 kWh generated):

My own usage averages to about 9 kWh/day, so output on a very cloudy summer day does not cover it :|

Over the course of May, daily production was on average 15.4 kWh/day:

For that month, from the 478 kWh produced I have returned/loaned/stored 371 kWh to the grid, and used 188 kWh from the grid during evenings.

All this is during near-midsummer sunny month, in a fairly northern (55°N) latitude. I’ll have to see how that works out during winter :)

What’s the cost breakdown?

Total cost of setting up everything was about 5200€:

  • Solar panels 2120€ (40%)
  • Power inverter 1310€ (25%)
  • Design, paperwork, permits, all the Vogon stuff 800€ (15%)
  • Construction work & transportation 680€ (14%)
  • Roof fixture 300€ (6%)

So yeah, this means that even if future prices of the panels are expected to fall further, by itself that won’t affect the total cost that much. I would expect that future paperwork prices should fall down too, since today that process is way too involved & complexicated IMHO.

I should get about 30% of the cost back, due to some sort of government (or EU?) programs that cover that amount of solar (and I guess wind/hydro too) installations. But that will be more paperwork sometime later this year; will see.

What’s the ROI? Why do this?

Return on investment is something like 10 years, assuming roughly stable electricity prices, and if the solar modules retain 90% of their efficiency at the end of that.

Purely from financial perspective, it’s not an investment that would be worth the hassle, at this scale at least.

However, that assumes that the price I pay for electricity is the total actual cost of electricity. Which I think is not true; there’s a massive hidden cost that we all happily ignore – but is distributed to other poor people (or future ourselves) in terms of droughts, fires, floods, political instabilities, wars and so on. Solar has some hidden cost too (mining rare minerals needed for the solar modules; that is a finite resource and has long-lasting non-trivial effects on the places where mining happens), but it feels like today that’s a lesser evil than the alternative of coal/oil/gas.

So if I can do even a tiny part towards “slightly better balance”, I’m happy to do it. That’s it!

South Korea Vacation Report 2017

$
0
0

This June we’ve spent two weeks traveling in South Korea, so here’s a writeup and a bunch of photos.

Caveats: my first trip there, and very likely I mis-planned something or missed some obvious “oh my god can’t miss that” things to see or do.

Our trip was two weeks; with myself, my wife and two kids (14 and 8yo). If you’re going alone, or for a honeymoon, or with a group of friends, the experience might be very different.

Planning

We did the itinerary ourselves, using the same old method of wikipedia + wikitravel + random blogs + asking around. Planning via writing rough outline in google docs and marking up places in a custom google map.

And here was the first challenge: Google does not have that much information on Korea, especially in the maps department. Apparently this is due to an old law that prevents mapping/GIS data to be exported for foreign countries & companies (see thisquora answer). Does not make much sense these days, but oh well.

It’s not a big problem, but made me realize how much I have learned to depend on Google for planning trips. “A lot”, and that’s slightly scary.

What we came up with was this: in two weeks, we go to Seoul (3 nights), Sokcho (2 nights), Gyeongju (1 night), Busan (3 nights), Jeju (2 nights), Seoul (2 nights). Did not have any concrete goals, except “see some cities, nature, people, temples, food”. Wanted to check out some K-pop concert, but about the only one happening during that time (of Monsta-X) got sold out in like two minutes :|

Getting Around

We did not rent a car, instead were traveling mostly by metro & bus. T-money card for local transit works conveniently; metro goes often & on time. Both Seoul and Busan and really large cities, so getting from one place to another takes a lot of time. Outside of big cities, figuring out how exactly to get from A to B, is a bit of a challenge. For example bus terminal in Sokcho barely has any information in English, and not many people speak it either.

As mentioned before, Google Maps does not have exhaustive information, so I used a bunch of other apps to figure out buses, trains, places to go and so on. Some of them are Korean only, but after some fiddling I was able to semi-randomly get by.

Speaking of language… my older kid has learned to read & write Hangul (and some Korean words) as a hobby, and that was useful! The writing looks intimidating for someone who sees it the first time, but actually it’s fairly simple! There’s only a few dozen letters; they are just arranged in a non-linear fashion (instead each syllable is arranged into a square block).

I do recommend to check it out. If nothing else, know that ㅇ at top is silent (does not do anything), and at the bottom is “ng”. With just that you can already tell some words apart!

One place where we should have rented a car is Jeju. It seems small, but public transport there is… not terribly good, shall I say. Rare, slow and crowded buses, and fairly long walking distances from bus stops to anything. Do rent a car or hire a fulltime taxi!

Staying

Wow, Korean apartments are small! It makes sense since South Korea is one of the mostdensely populated countries. We mostly used airbnb, and learned the hard way that many listings with “two rooms” are actually one area with two beds tucked to the ceiling and a narrow staircase to get into them :)

Stayed a couple nights in a hanok in Bukchon, and that was nice!

Aside about airbnb: lately overall it feels kinda “meh”. A number of years ago airbnb meant you could experience places that are somehow personal; places where someone lives. These days, more and more airbnb apartments are rented full-time, with the same darn Ikea stuff in all of them. Often you don’t even meet anyone, just get a message with they keypad code and that’s it. It’s kinda like going to a hotel, without any of the advantages of a hotel. Meh!

Culture

We learned that selfies are important, especially if you’re showing V sign or some sort of heart symbol in them. Overall they are pretty serious about that stuff:

So we tried to blend in,

Cult of “youthful, perfect” beauty is fairly big here, it seems. At least it’s kinda equally divided among sexes. Maybe even larger part of ads & posters with “here’s someone beautiful” image had a guy in them. Makeup is important, clothes are important, etc. I’ve read somewhere that “if you go with just t-shirt and jeans, people will think you’ve given up on life”. We went mostly in t-shirts and jeans :)

Feels like Koreans love to write up instructions everywhere, especially about what you’re not supposed to do. Can’t stray from the predetermined path. Can’t take photos in that direction. etc. etc.

We were surprised at the amount of meat, specifically pork, that is everywhere. Being a vegetarian or vegan must be pretty hard there. Another surprise - lack of bread (something hard to imagine for an Eastern European). Food is generally rice, pork, seafood and kimchi, and fairly spicy.

Photo Impressions

Almost all photos are taken by my wife. Equipment: Canon EOS 70D with Canon 24-70mm f/2.8 L II and Sigma 8-16mm f/4.5-5.6. Some taken by iPhone 6 or iPhone SE.

Seoul, Samcheong-Dong 삼청동

The area where we stayed in a hanok village, close the old imperial palaces. Narrow, steep streets. Mountains in the background on one side, highrise glass buildings on the other side. And churros that are better than a boyfriend!

Seoul, Bugaksan mountain 북악산

The hiking trail goes along the old city wall, right north to the Blue House (residence of the president). Probably for that reason you need to fill out registration form, there are guards every hundred meters, and a few layers of barbed wire, cameras and stuff. I got used to not having all that back home!

Seoul, Cheonggyecheon stream 청계천

Very nice walk in the center of Seoul. Great contrast of the nature & surrounding highrise.

Sokcho 속초

Went to Sokcho for a hike in Seoraksan national park nearby. After Seoul, this felt small and a bit empty? That said, after Seoul a lot of places can feel that way :) Apparently a lot of people go to Sokcho for the seafood, but none of us are big seafood fans, so that part was out. We walked around the seaside and went to the park the next day.

Seoraksan National Park 설악산국립공원

Sinheungsa temple (신흥사) is right at the entrance to the park.

We walked for couple hours in Ulsanbawi (울산바위) direction. Did not get to the actual rock formation since it’s a longer hike, and would probably be too hard for the kids.

Took a cable car towards Gwongeumseong fortress (설악산 권금성), around 800 meters elevation.

The photos above make it look as if there’s not that many people in the park. That was definitelynot the case though. It was Saturday, and it was packed with visitors; apparently Koreans love walking or hiking in their national parks. We were very impressed by 2-4 year old kids walking and climbing stones on fairly long trails.

Gyeongju 경주

Used to be capital of the ancient Silla kingdom. A lot of tumuli and other olden things around.

There’s a big Bulguksa 불국사 temple nearby. Overall temples in Korea - at least the ones we’ve seen - feel more like museum sites than active temples. Very different impression from the buddhist temples that we saw in China, for example. South Korea is a fairly non-religious country, by the way.

Busan 부산

We liked Busan a lot! However the city is very spread out so getting from one place to another took a lot of time on the metro. We stayed in Haeundae area based on some internet advice.

The apartment we stayed in was impressively tiny! Which is fairly typical for the whole Korea, I guess.

Busan, Haedong Yonggungsa temple 해동 용궁사

An hour bus ride from Busan, a nice temple on the seaside.

Busan, Gamcheon Village 감천문화마을

OMG the streets are steep there! This was lovely, just take a local bus there instead of climbing all the way up from metro stop like we did :)

Jeju Island 제주도

Took a flight to Jeju from Busan Gimhae airport, and we stayed on the southern part.

Jeju is often listed as a “must visit” type of destination, but frankly we were not terribly impressed. Maybe because we made a mistake of thinking that we can get by public transportation like elsewhere in Korea – do not do that; just rent a car or hire a fulltime taxi! Oh right, I already mentioned this above… Overall, the whole place felt a bit of “too touristy” for our tastes at least.

The volcanic ash/rock formations - Yongmeori Coast (용머리해안) - near Sanbangsan Mountain (산방산) were pretty cool! There’s a Sanbanggulsa Temple (산방굴사) right there too.

Seoul, Itaewon 이태원

Flew back to Seoul Gimpo airport, and our last stay was in Itaewon district. Generally in Korea you see very few foreigners; not so in Itaewon! We had nice food, went to the N Tower and theLeeum museum. Was nice!

And then the next morning it was a long flight home!

Unreasonable Effectiveness of Profilers

$
0
0

A couple months ago I added profiling output to our build system (a fork of JamPlus). It’s a simple Chrome Tracing view, and adding support for that to Jam was fairly easy. Jam being written in C, I found a simple C library to do it (minitrace) and with a couple compilation fixes it was working and had profiler blocks around whatever tasks the build system was executing.

That by itself is not remarkable. However… once you have profiling output, you can start to…

Notice Things

The other day I was doing something unrelated, and for some reason looked at a profiler output of Unity editor build I’ve just done. “Common sense” about C++ codebases tells us that usually it’s the linking time that’s The Worst, however here it was not that:

There’s a whole gap right before linking starts, when everything else is done, just the build is waiting for one C++ file to compile. I was busy with something else right then, so added a TODO card to our team task board, to be looked at later.

Sometime later I was doing a different build (of just the “engine” without the editor bits), and looked at the profiler too:

Now that looks pretty bad. The total build time (this was a “full rebuild”) was ten minutes, and almost five of them were “wait for that one C++ file to finish compiling”. The file in question had a compile time ofseven minutes.

This sounded like a build inefficiency that is too large to ignore, so I dug in for a bit.

Aside: at the moment our small “build team” has not even started to look into “full build” performance, for various reasons. Mostly repaying tech debt (with interest!), optimizing incremental build performance and improving things like IDE projects. Optimizing full build time we will get to, but haven’t just yet.

7 minutes compile time for one file? Craaazyy!

Yes, it is crazy. Average compile time for C++ files in this project and this config (win64 Release) is about 2 seconds. 400+ seconds is definitely an outlier (though there’s a handful of other files that take 30+ seconds to compile). What is going on?!

I did some experiments and figured out that:

  • Our Lump/Batch/Unity builds are not the culprit; there’s one .cpp file in that particular lump that takes all the time to compile.
  • MSVC compiler exhibits this slow compilation behavior; clang compile times on that file are way better (10+ times faster).
  • Only Release builds are this slow (or more specifically, builds where inlining is on).
  • The fairly old VS2010 compiler that we use is not the culprit; compiling with VS2015 is actually a tiny bit slower :(
  • In general the files that have 30+ second compile time in Release build with MSVC compiler tend to be heavy users of our “SIMD math library”, which provides a very nice HLSL-like syntax for math code (including swizzles & stuff). However the implementation of that is… shall we say… quite template & macro heavy.
  • That 7 minute compile file had a big SIMD math heavy function, that was templated to expand into a number of instantiations, to get rid of runtime per-item branches. This is in CPU performance sensitive code, so that approach does make sense.

Whether the design of our math library is a good trade-off or not, is a story for another day. Looks like it has some good things (convenient HLSL-like usage, good SIMD codegen), and some not so good things (crazy complex implementation, crazy compile times on MSVC at least). Worth discussing and doing something about it in the future!

Meanwhile… could some lo-tech changes be made, to speed up the builds?

Speeding it up

One easy change that is entirely in “build systems” area even, is to stop including these “slow to compile” files into lump/batch/unity builds. Lump builds primarily save time on invoking the compiler executable, and doing preprocessing of typically similar/common included code. However, all that is sub-second times; if a single source file takes 10+ seconds to compile then there’s little point in lumping. By itself this does not gain much, however for incremental builds people won’t have to wait too long if they are working on a fast-to-build file that would have ended in the same lump as a slow file.

Could also somehow make the build system schedule slow files for compilation as soon as possible. The earlier they start, the sooner they will finish. Ideally the build system would perhaps have historical data of past compile times, and use that to guide build task scheduling. We don’t have that in our build system (yet?)… However in our current build code, moving slow files out of lumps makes them be built earlier as a by-product. Good!

The above things didn’t actually speed up compilation of that 7-minute file, but were trivial to do and gained a minute or so out of full build time (which was 10 minutes originally).

And then I tried something that I didn’t have high hopes of working - in that slow file, factor out parts of the big templated function into smaller, less-templated functions.

Fairly trivial stuff; if you’re into fancy refactoring IDEs that is done by “select some code lines, press Extract Method/Function button”. Except this is C++, and the IDEs don’t quite get this right (at least in this code), so you do it manually.

I split off five or so functions like that and… compile time of that file went from 420 seconds to 70 seconds. That is six times faster!

Of course, factoring out functions can mean they are no longer inlined, and the original code will have to call them. So that’s time spent in passing the arguments, doing the jump etc. However, it could make parent function use registers better (or worse…), could result in lower amount of total code (less I$ misses), etc. We have profiled the code change on several platforms, and the difference in performance seems to be negligible. So in this particular case, it’s a go!

Now of course, a minute to compile a C++ file is still crazy, but additional speedups probably involve changing the design of our math library or somesuch – needs more work than someone clueless randomly trying to speed it up :)

The build profile looks much better after the change. No longer gaps of “all the CPU cores wait for one job to finish” type of stuff! Well ok, linking is serial but that is old news. Full build time went from 10 minutes down to 5min 10sec, or almost 2x faster!

Takeaways

  • Add some sort of profiling data capture to everything you care about. Had I not added the profiler output, who knows when (or if?) someone would have noticed that we have one super-slow to compile C++ source file. In my case, adding this simple profiling capture to our build system took about a day… most of that spent learning about Jam’s codebase (my first change in it).
    • Seriously, just do it. It’s easy, fun and worth it!
  • Every template instantiation creates additional work for the compiler’s optimizer; pretty much as if the instantiated functions were literally copy-pasted. If a templated function was slow to compile and you instantiate the template 20 times… well now it’s very slow to compile.
    • Factoring out parts into less-templated functions might help things.
  • Complicated template-heavy libraries can be slow to compile (“well duh”, right). But not necessarily due to parsing (“it’s all header files”); the optimizer can spend ages in them too. In MSVC case in this code, from what I can tell it ends up spending all the time deciding what & how to inline.
  • Speeding up builds is good work, or at least I like to think so myself :) Less time spent by developers waiting for them; better throughput and lower latency in build farms, etc. etc.

Cross Platform Shaders in 2012

$
0
0
Update: Cross Platform Shaders in 2014. Since about 2002 to 2009 the de facto shader language for games was HLSL. Everyone on PCs was targeting Windows through Direct3D, Xbox 360 uses HLSL as well, and Playstation 3 uses Cg, which for all practical purposes is the same as HLSL. There were very few people targeting Mac OS X or Linux, or using OpenGL on Windows. One shader language ruled the world, and everything was rosy.

Non Power of Two Textures

$
0
0
Support for non power of two (“NPOT”, i.e. arbitrary sized) textures has been in GPUs for quite a while, but the state of support can be confusing. Recent question from @rygorous: Lazyweb, <…> GL question: <…> ARB NPOT textures is fairly demanding, and texture rectangle are awkward. Is there an equivalent to ES2-style semantics in regular GL? Bonus Q: Is there something like the Unity HW survey, but listing supported GL extensions?

Adventures in 3D Printing

$
0
0
I shamelessly stole whole idea from Robert Cupisz and did some 3D printed earrings. TL;DR: raymarching, marching cubes, MeshLab. Now for the longer version… Step 1: pick a Quaternion Julia fractal As always, Iñigo Quilez’ work is a definitive resource. There’s a ready-made GLSL shader for raymarching this fractal in ShaderToy (named “Quaternion”), however current state of WebGL doesn’t allow loops with dynamic number of iterations, so it does not quite work in the browser.

"Parallel for" in Apple's GCD

$
0
0
I was checking out OpenSubdiv and noticed that on a Mac it’s not exactly “massively parallel”. Neither of OpenGL backends work (transform feedback one requires GL 4.2, and compute shader one requires GL 4.3 - but Macs right now can only do GL 3.2), OpenCL backend is much slower than the CPU one (OS X 10.7, GeForce GT 330M) for some reason, I don’t have CUDA installed so didn’t check that one, and OpenMP isn’t exactly supported by Apple’s compilers (yet?

Mobile Hardware Stats (and more)

$
0
0
Short summary: Unity’s hardware stats page now has a “mobile” section. Which is exactly what it says, hardware statistics of people playing Unity games on iOS & Android. Go to stats.unity3d.com and enjoy. Some interesting bits: Operating systems iOS uptake is crazy high: 98% of the market has iOS version that’s not much older than one year (iOS 5.1 was released in 2012 March). You’d be quite okay targetting just 5.

Reviewing ALL THE CODE

$
0
0
I like to review ALL THE THINGS that are happening in our codebase. Currently we have about 70 programmers, mostly comitting to a single Mercurial repository (into a ton of different branches), producing about 120 commits per day. I used to review all that using RhodeCode’s “journal” page, but Lucas taught me a much better way. So here it is. Quick description of our current setup We use Mercurial for source control, with largefiles extension for versioning big binary files.

Iceland Vacation Report

$
0
0
tl;dr: Just spent a week in Iceland and it was awesome! Some folks have asked for impressions of my Iceland vacation or some advice, so here it goes. Caveats: my first (and only so far) trip there, we went with kids, came up with the itinerary ourselves (with some advice from friends), etc. Our trip was one week; myself, my wife and two kids (10 and 4yo). If you’re going alone, or for a honeymoon, or with a group of friends, the experience might be very different.
Viewing all 256 articles
Browse latest View live