Quantcast
Channel: Aras' website
Viewing all 256 articles
Browse latest View live

Importing cubemaps from single images

$
0
0

So this tweet on EXR format in texture pipeline and replies on cubemaps made me write this…

Typically skies or environment maps are authored as regular 2D textures, and then turned into cubemaps at “import time”. There are various cubemap layouts commonly used: lat-long, spheremap, cross-layout etc.

In Unity 4 we had the pipeline where the user had to pick which projection the source image is using. But for Unity 5, ReJ realized that it’s just boring useless work! You can tell these projections apart quite easily by looking at image aspect ratio.

So now we default to “automatic” cubemap projection, which goes like this:

  • If aspect is 4:3 or 3:4, it’s a horizontal or vertical cross layout.
  • If aspect is square, it’s a sphere map.
  • If aspect is 6:1 or 1:6, it’s six cubemap faces in a row or column.
  • If aspect is 1:1.85, it’s a lat-long map.

Now, some images don’t quite match these exact ratios, so the code is doing some heuristics. Actual code looks like this right now:

float longAxis = image.GetWidth();
float shortAxis = image.GetHeight();
bool definitelyNotLatLong = false;
if (longAxis < shortAxis)
{
    Swap (longAxis, shortAxis);
    // images that have height > width are never latlong maps
    definitelyNotLatLong = true;
}

const float aspect = shortAxis / longAxis;
const float probSphere = 1-Abs(aspect - 1.0f);
const float probLatLong = (definitelyNotLatLong) ?
    0 :
    1-Abs(aspect - 1.0f / 1.85f);
const float probCross = 1-Abs(aspect - 3.0f / 4.0f);
const float probLine = 1-Abs(aspect - 1.0f / 6.0f);
if (probSphere > probCross &&
    probSphere > probLine &&
    probSphere > probLatLong)
{
    // sphere map
    return kGenerateSpheremap;
}
if (probLatLong > probCross &&
    probLatLong > probLine)
{
    // lat-long map
    return kGenerateLatLong;
}
if (probCross > probLine)
{
    // cross layout
    return kGenerateCross;
}
// six images in a row
return kGenerateLine;

So that’s it. There’s no point in forcing your artists to paint lat-long maps, and use some external software to convert to cross layout, or something.

Now of course, you can’t just look at image aspect and determine all possible projections out of it. For example, both spheremap and “angular map” are square. But in my experience heuristics like the above are good enough to cover most common use cases (which seem to be: lat-long, cross layout or a sphere map).


Divide and Conquer Debugging

$
0
0

It should not be news to anyone that ability to narrow down a problem while debugging is an incredibly useful skill. Yet from time to time, I see people just helplessly randomly stumbling around, when they are trying to debug something. So with this in mind (and also “less tweeting, more blogging!” in mind for 2015), here’s a practical story.

This happened at work yesterday, and is just an ordinary bug investigation. It’s not some complex bug, and investigation was very short - all of it took less time than writing this blog post.

Bug report

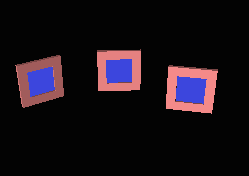
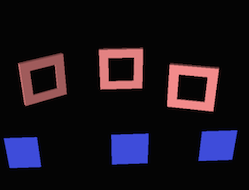
We’re adding iOS Metal support toUnity 4.6.x, and one of the beta testers reported this:“iOS Metal renders submeshes incorrectly”. There was a nice project attached that shows the issue very clearly. He has some meshes with multiple materials on them, and the 2nd material parts are displayed in the wrong position.

The scene looks like this in the Unity editor:

But when ran on iOS device, it looks like this:

Not good! Well, at least the bug report is very nice :)

Initial guesses

Since the problematic parts are the second material on each object, and it only happens on the device, then the user’s “iOS Metal renders submeshes incorrectly” guess makes perfect sense (spoiler alert: the problem was elsewhere).

Ok, so what is different between editor (where everything works) and device (where it’s broken)?

  • Metal: device is running Metal, whereas editor is running OpenGL.
  • CPU: device is running on ARM, editor running on Intel.
  • Need to check which shaders are used on these objects; maybe they are something crazy that results in differences.

Some other exotic things might be different, but first let’s take the above.

Initial Cuts

Run the scene on the device using OpenGL ES 2.0 instead. Ha! The issue is still there. Which means Metal is not the culprit at all!

Run it using a slightly older stable Unity version (4.6.1). The issue is not there. Which means it’s some regression somewhere since Unity 4.6.1 and the code we’re based on now. Thankfully that’s only a couple weeks of commits.

We just need to find what regressed, when and why.

Digging Deeper

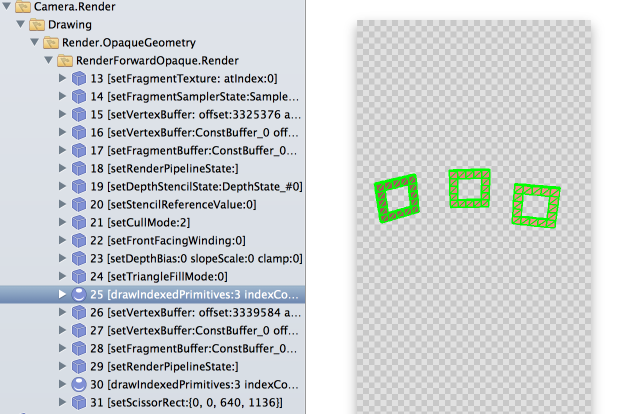
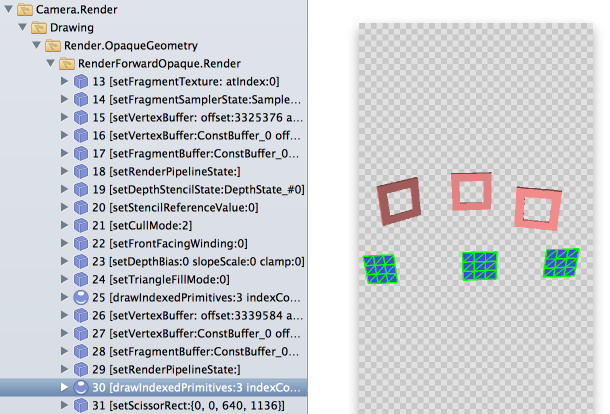
Let’s look at the frame on the device, using Xcode frame capture.

Hmm. We see that the scene is rendered in two draw calls (whereas it’s really six sub-objects), via Unity’s dynamic batching.

Dynamic batching is a CPU-side optimization we have where small objects using identical rendering state are transformed into world space on the CPU, into a dynamic geometry buffer, and rendered in a single draw call. So this spends some CPU time to transform the vertices, but saves some time on the API/driver side. For very small objects (sprites etc.) this tends to be a win.

Actually, I could have seen that it’s two draw calls in the editor directly, but it did not occur to me to look for that.

Let’s check what happens if we explicitly disable dynamic batching. Ha! The issue is gone.

So by now, what we know is: it’s some recent regression in dynamic batching, that happens on iOS device but not in the editor; and is not Metal related at all.

But it’s not that “all dynamic batching got broken”, because:

  • Half of the bug scene (the pink objects) are dynamic-batched, and they render correctly.
  • We do have automated graphics tests that cover dynamic batching; they run on iOS; and they did not notice any regressions.

Finding It

Since the regression is recent (4.6.1 worked, and was something like three weeks old), I chose to look at everything that changed since that release, and try to guess which changes are dynamic batching related, and could affect iOS but not the editor.

This is like a heuristic step before/instead of doing actual “bisecting the bug”. Unity codebase is large and testing builds isn’t an extremely fast process (mercurial update, build editor, build iOS support, build iOS application, run). If the bug was a regression from a really old Unity version, then I probably would have tried several in-between versions to narrow it down.

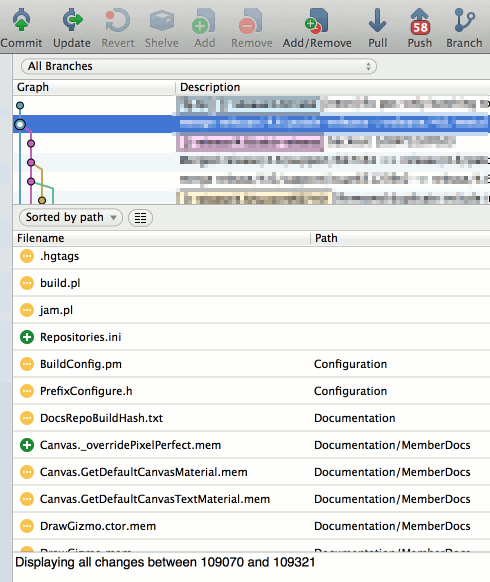
I used perhaps the most useful SourceTree feature - you select two changesets, and it shows the full diff between them. So looking at the whole diff was just several clicks away:

A bunch of changes there are immediately “not relevant” - definitely everything documentation related; almost definitely anything editor related; etc.

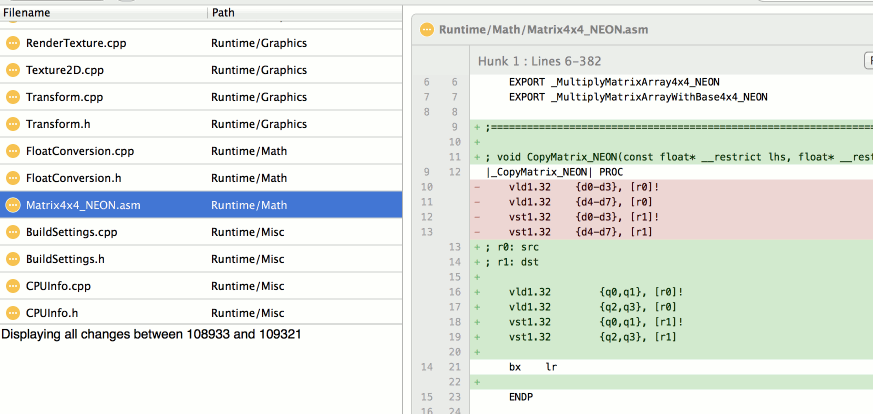
This one looked like a candidate for investigation (a change in matrix related ARM NEON code):

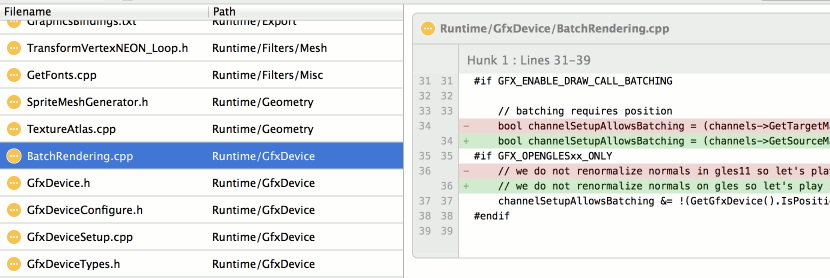
This one interesting too (a change in dynamic batching criteria):

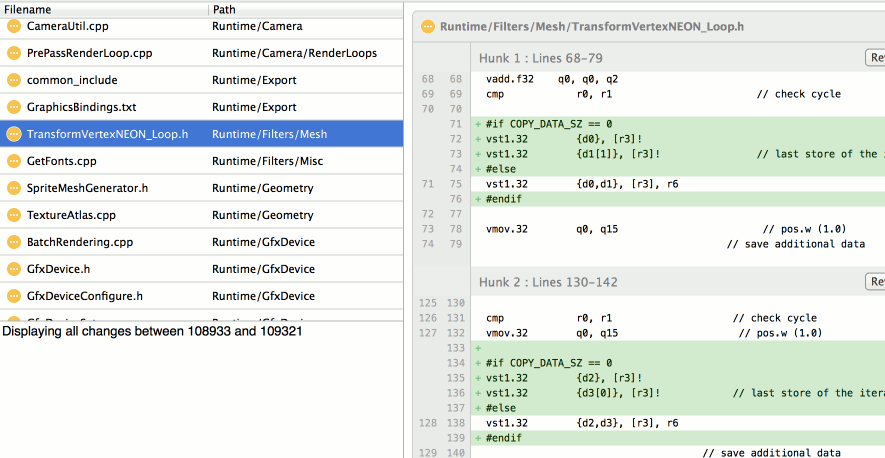
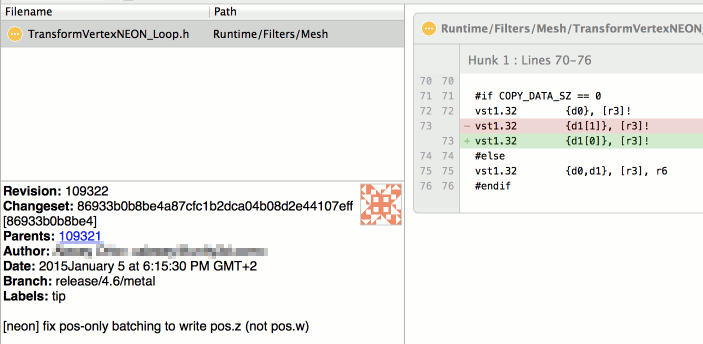
And this one (a change in dynamic batching ARM NEON code):

I started looking at the last one…

Lo and behold, it had a typo indeed; the {d1[1]} thing was storing thew component of transformed vertex position, instead of z like it’s supposed to!

The code was in the part where dynamic batching is done on vertex positions only, i.e. it was only used on objects with shaders that only need positions (and not normals, texture coordinates etc.). This explains why half of the scene was correct (pink objects use shader that needs normals as well), and why our graphics tests did not catch this (so turns out, they don’t test dynamic batching with position-only shaders).

Fixing It

The fix is literally a one character change:

…and the batching code is getting some more tests.

Curious Case of Slow Texture Importing, and xperf

$
0
0

I was looking at a curious bug report: “Texture importing got much slower in current beta”. At first look, I dismissed it under “eh, someone’s being confused” (quickly tried on several textures, did not notice any regression). But then I got a proper bug report with several textures. One of them was importing about 10 times slower than it used to be.

Why would anyone make texture importing that much slower? No one would, of course. Turns out, this was an unintended consequence of generally improving things.

But, the bug report made me use xperf (a.k.a. Windows Performance Toolkit) for the first time. Believe it or not, I’ve never used it before!

So here’s the story

We’ve got a TGA texture (2048x2048, uncompressed - a 12MB file) that takes about 10 seconds to import in current beta build, but it took ~1 second on Unity 4.6.

First wild guess: did someone accidentally disable multithreaded texture compression? Nope, doesn’t look like it (making final texture be uncompressed still shows massive regression).

Second guess: we are using FreeImage library to import textures. Maybe someone, I dunno, updated it and comitted a debug build? Nope, last change to our build was done many moons ago.

Time to profile. My quick “I need to get some answer in 5 seconds” profiler on Windows isVery Sleepy, so let’s look at that:

Wait what? All the time is spent in WinAPI ReadFile function?!

Is there something special about the TGA file I’m testing on? Let’s make the same sized, uncompressed PNG image (so file size comes out the same).

The PNG imports in 108ms, while TGA in 9800ms (I’ve turned off DXT compression, to focus on raw import time). In Unity 4.6 the same work is done 116ms (PNG) and 310ms (TGA). File sizes roughly the same. WAT!

Enter xperf

Asked a coworker who knows something about Windows: “why would reading one file spend all time in ReadFile, but another file of same size read much faster?“, and he said “look with xperf”.

I’ve read about xperf at the excellentBruce Dawson’s blog, but never tried it myself. Before today, that is.

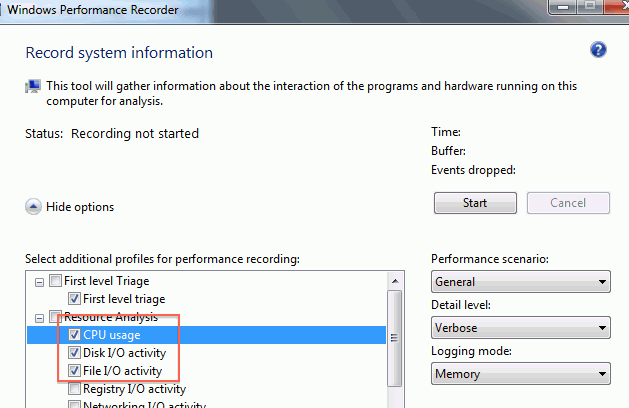
So, launch Windows Performance Recorder (I don’t even know if it comes with some VS or Windows SDK version or needs to be installed separately… it was on my machine somehow), tick CPU and disk/file I/O and click Start:

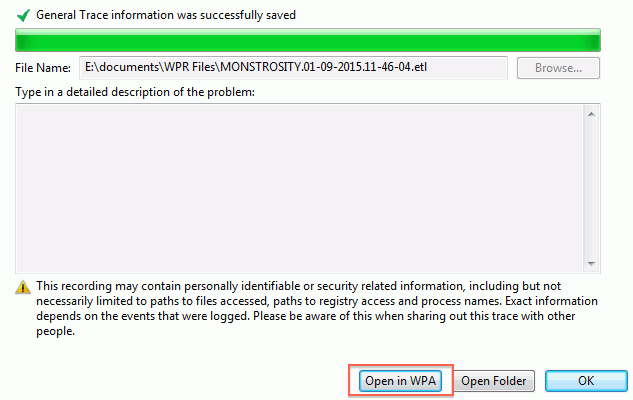
Do texture importing in Unity, click save, and on this fairly confusing screen click “Open in WPA”:

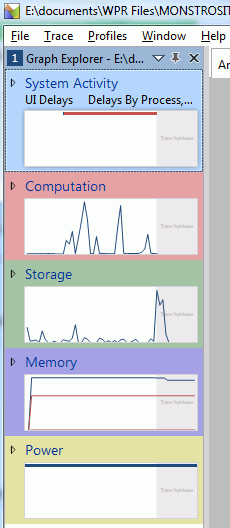
The overview in the sidebar gives usage graphs of our stuff. A curious thing: neither CPU (Computation) nor Storage graphs show intense activity? The plot thickens!

CPU usage investigation

Double clicking the Computation graph shows timeline of CPU usage, with graphs for each process. We can see Unity.exe taking up some CPU during a time period, which the UI nicely highlights for us.

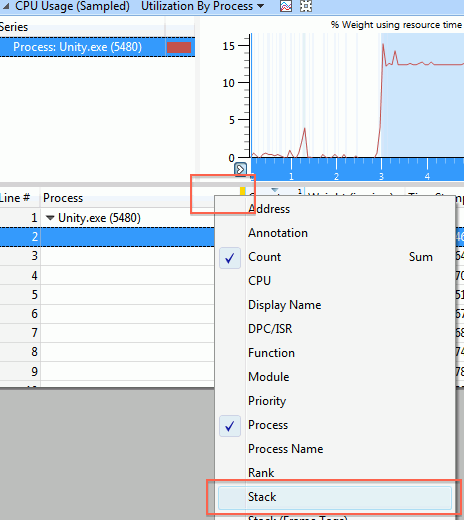
Next thing is, we want to know what is using the CPU. Now, the UI groups things by the columns on the left side of the yellow divider, and displays details for them on the right side of it. We’re interested in a callstack now, so context-click on the left side of the divider, and pick “Stack”:

Oh right, to get any useful stacks we’ll need to tell xperf to load the symbols. So you goTrace -> Configure Symbol Paths, add Unity folder there, and then Trace -> Load Symbols.

And then you wait. And wait some more…

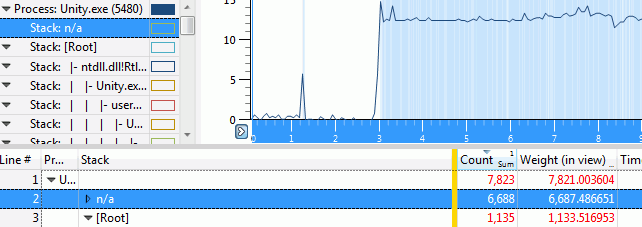
And then you get the callstacks! Not quite sure what the “n/a” entry is; my best guess that just represents unused CPU cores or sleeping threads or something like that.

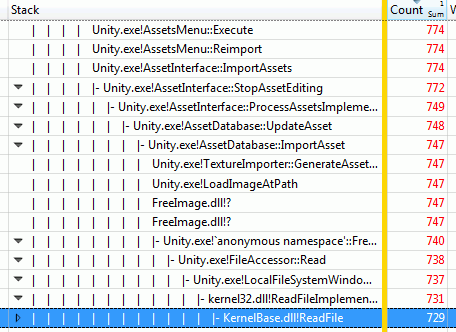
Digging into the other call stack, we see that indeed, all the time is spent in ReadFile.

Ok, so that was not terribly useful; we already knew that from the Very Sleepy profiling session.

Let’s look at I/O usage

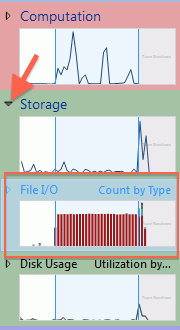
Remember the “Storage” graph on sidebar that wasn’t showing much activity? Turns out, you can expand it into more graphs.

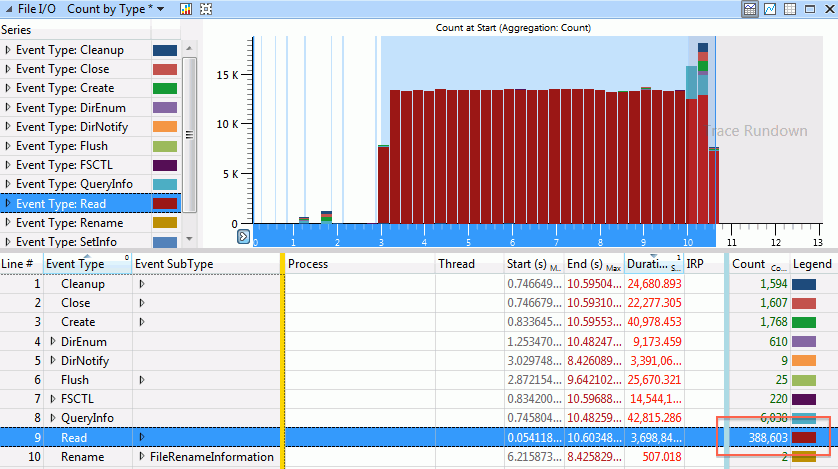
Now we’re getting somewhere! The “File I/O” overview graph shows massive amounts of activity, when we were importing our TGA file. Just need to figure out what’s going on there. Double clicking on that graph in the sidebar gives I/O details:

You can probably see where this is going now. We have a lot of file reads, in fact almost 400 thousand of them. That sounds a bit excessive.

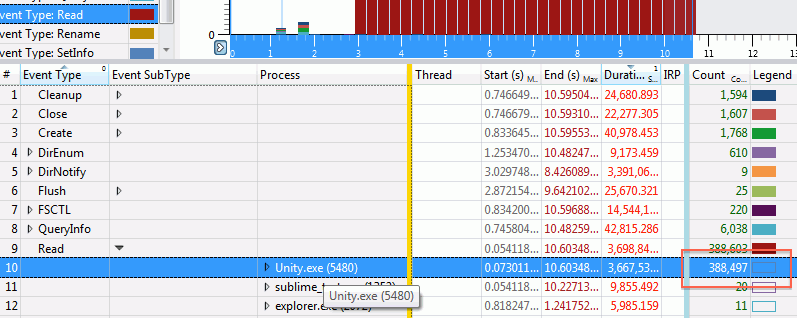
Just like in the CPU part, the UI sorts on columns to the left of the yellow divider. Let’s drag the “Process” column to the left; this shows that all these reads are coming from Unity indeed.

Expanding the actual events reveals the culprit:

We are reading the file alright. 3 bytes at a time.

But why and how?

But why are we reading a 12 megabyte TGA file in three-byte chunks? No one updated our image reading library in a long time, so how come things have regressed?

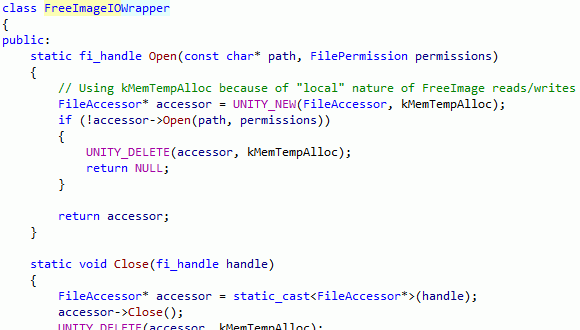
Found the place in code where we’re calling into FreeImage. Looks like we’re setting up our own I/O routines and telling FreeImage to use them:

Version control history check: indeed, a few weeks ago a change in that code was made, that switched from basically “hey, load an image from this file path” to “hey, load an image using these I/O callbacks”

This generally makes sense. If we have our own file system functions, it makes sense to use them. That way we can support reading from some non-plain-files (e.g. archives, or compressed files), etc. In this particular case, the change was done to support LZ4 compression in lightmap cache (FreeImage would need to import texture files without knowing that they have LZ4 compression done on top of them).

So all that is good. Except when that changes things to have wildly different performance characteristics, that is.

When you don’t pass file I/O routines to FreeImage, then it uses a “default set”, which is just C stdio ones:

Now, C stdio routines do I/O buffering by default… our I/O routines do not. And FreeImage’s TGA loader does a very large number of one-pixel reads.

To be fair, the “read TGA one pixel at a time” seems to be fixed in upstream FreeImage these days; we’re just using a quite old version. So looking at this bug made me realize how old our version of FreeImage is, and make a note to upgrade it at some point. But not today.

The Fix

So, a proper fix here would be to setup buffered I/O routines for FreeImage to use. Turns out we don’t have any of them at the moment. They aren’t terribly hard to do; I poked the relevant folks to do them.

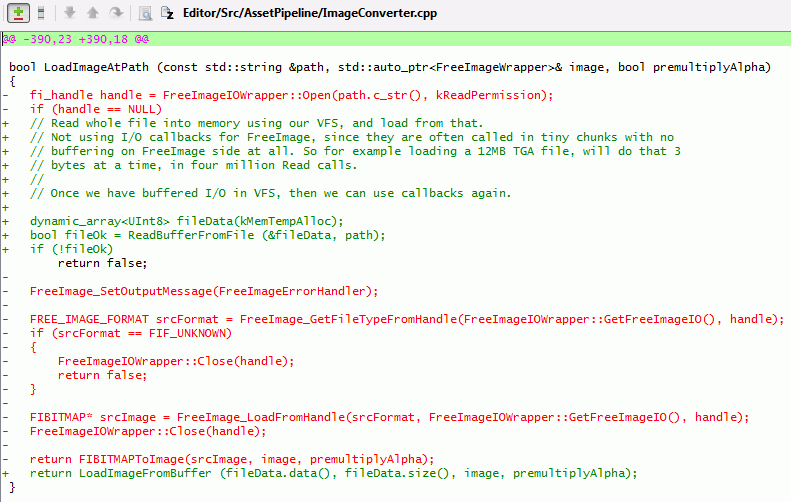
In the meantime, to check if that was really the culprit, and to not have “well TGAs import much slower”, I just made a hotfix that reads whole image into memory, and then loads from that.

Is it okay to read whole image into memory buffer? Depends. I’d guess in 95% cases it is okay, especially now that Unity editor is 64 bit. Uncompressed data for majority of images will end up being much larger than the file size anyway. Probably the only exception could be .PSD files, where they could have a lot of layers, but we’re only interested in reading the “composited image” file section. So yeah, that’s why I said “hotfix”; and a proper solution would be having buffered I/O routines, and/or upgrading FreeImage.

This actually made TGA and PNG importing faster than before: 75ms for TGA, 87ms for PNG (Unity 4.6: 310ms TGA, 116ms PNG; current beta before the fix: 9800ms TGA, 108ms PNG).

Yay.

Conclusion

Be careful when replacing built-in functionality of something with your own implementation (e.g. standard I/O or memory allocation or logging or … routines of some library). They might have different performance characteristics!

xperf on Windows is very useful! Go and read Bruce Dawson’s blog for way more details.

On Mac, Apple’s Instruments is a similar tool. I think I’ll use that in some next blog entry.

I probably should have guessed that “too many, too small file read calls” is the actual cause after two minutes of looking into the issue. I don’t have a good excuse on why I did not. Oh well, next time I’ll know :)

Optimizing Shader Info Loading, or Look at Yer Data!

$
0
0

A story about a million shader variants, optimizing using Instruments and looking at the data to optimize some more.

The Bug Report

The bug report I was looking into was along the lines of “when we put these shaders into our project, then building a game becomes much slower – even if shaders aren’t being used”.

Indeed it was. Quick look revealed that for ComplicatedReasons™ we load information aboutall shaders during the game build – that explains why the slowdown was happening even if shaders were not actually used.

This issue must be fixed! There’s probably no really good reason we must know about all the shaders for a game build. But to fix it, I’ll need to pair up with someone who knows anything about game data build pipeline, our data serialization and so on. So that will be someday in the future.

Meanwhile… another problem was that loading the “information for a shader” was slow in this project. Did I say slow? It was very slow.

That’s a good thing to look at. Shader data is not only loaded while building the game; it’s also loaded when the shader is needed for the first time (e.g. clicking on it in Unity’s project view); or when we actually have a material that uses it etc. All these operations were quite slow in this project.

Turns out this particular shader had massive internal variant count. In Unity, what looks like“a single shader” to the user often hasmany variants inside (to handle different lights, lightmaps, shadows, HDR and whatnot - typical ubershader setup). Usually shaders have from a few dozen to a few thousand variants. This shader had 1.9 million. And there were about ten shaders like that in the project.

The Setup

Let’s create several shaders with different variant counts for testing: 27 thousand, 111 thousand, 333 thousand and 1 million variants. I’ll call them 27k, 111k, 333k and 1M respectively. For reference, the new “Standard” shader in Unity 5.0 has about 33 thousand internal variants. I’ll do tests on MacBook Pro (2.3 GHz Core i7) using 64 bit Release build.

Things I’ll be measuring:

  • Import time. How much time it takes to reimport the shader in Unity editor. Since Unity 4.5 this doesn’t do much of actual shader compilation; it just extracts information about shader snippets that need compiling, and the variants that are there, etc.
  • Load time. How much time it takes to load shader asset in the Unity editor.
  • Imported data size. How large is the imported shader data (serialized representation of actual shader asset; i.e. files that live in Library/metadata folder of a Unity project).

So the data is:

Shader   Import    Load    Size
   27k    420ms   120ms    6.4MB
  111k   2013ms   492ms   27.9MB
  333k   7779ms  1719ms   89.2MB
    1M  16192ms  4231ms  272.4MB

Enter Instruments

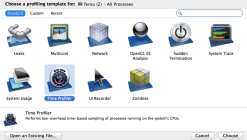
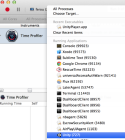
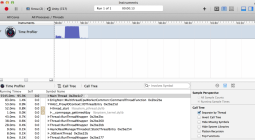
Last time we used xperf to do some profiling. We’re on a Mac this time, so let’s useApple Instruments. Just like xperf, Instruments can show a lot of interesting data. We’re looking at the most simple one, “Time Profiler” (though profiling Zombies is very tempting!). You pick that instrument, attach to the executable, start recording, and get some results out.

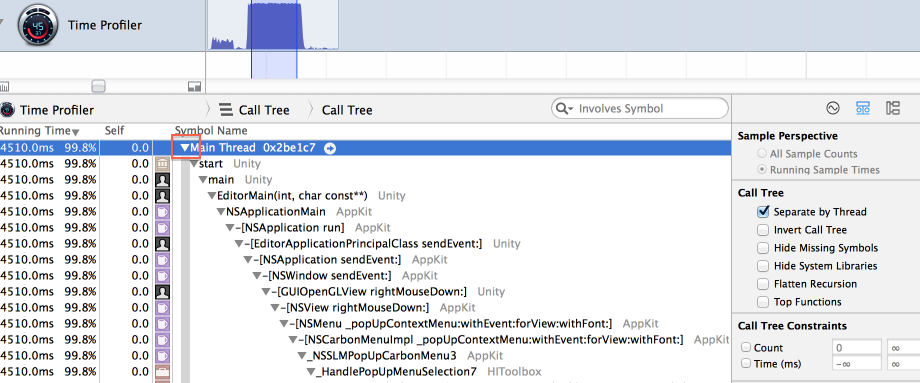
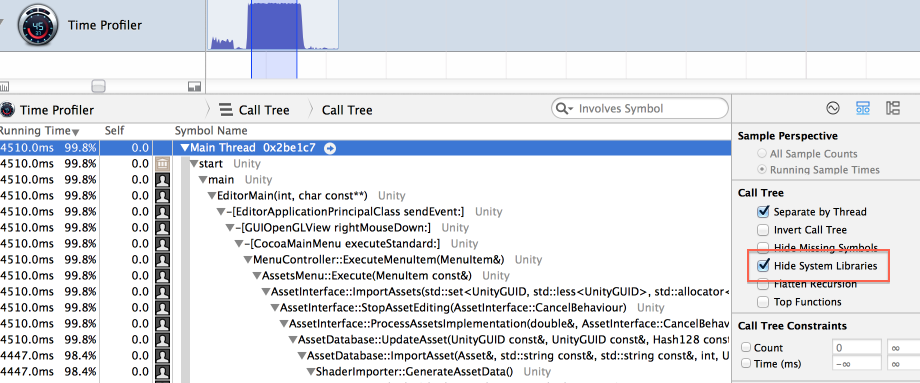
You then select the time range you’re interested in, and expand the stack trace. Protip: Alt-Click(ok ok, Option-Click you Mac peoples) expands full tree.

So far the whole stack is just going deep into Cocoa stuff. “Hide System Libraries” is very helpful with that:

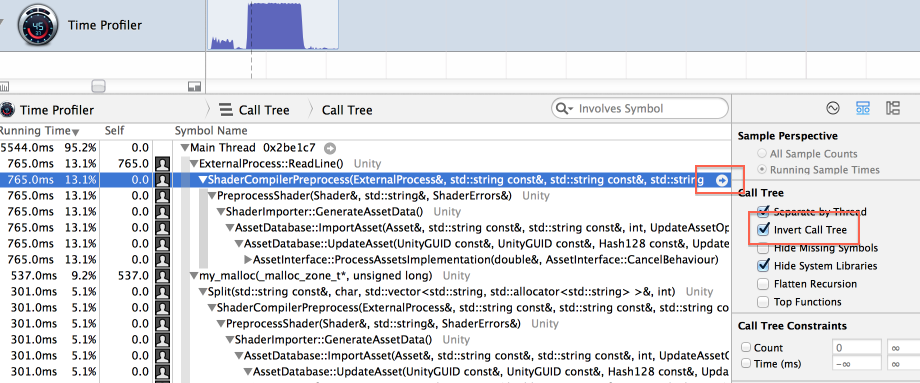
Another very useful feature is inverting the call tree, where the results are presented from the heaviest“self time” functions (we won’t be using that here though).

When hovering over an item, an arrow is shown on the right (see image above). Clicking on that does“focus on subtree”, i.e. ignores everything outside of that item, and time percentages are shown relative to the item. Here we’ve focused on ShaderCompilerPreprocess (which does majority of shader “importing” work).

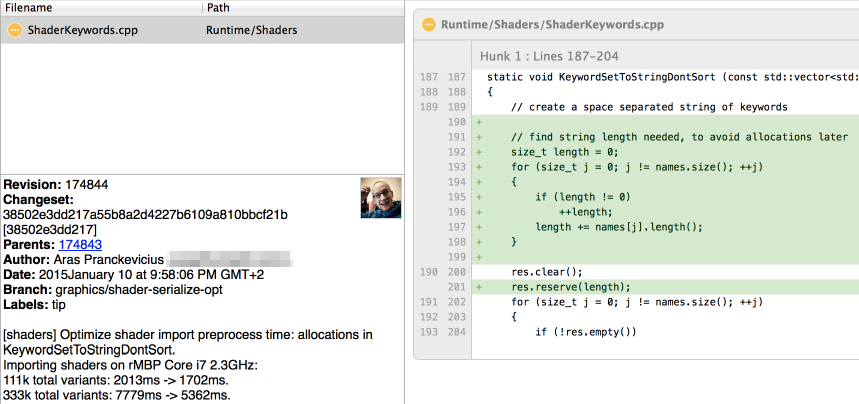
Looks like we’re spending a lot of time appending to strings. That usually means strings did not have enough storage buffer reserved and are causing a lot of memory allocations. Code change:

This small change has cut down shader importing time by 20-40%! Very nice!

I did a couple other small tweaks from looking at this profiling data - none of them resulted in any signifinant benefit though.

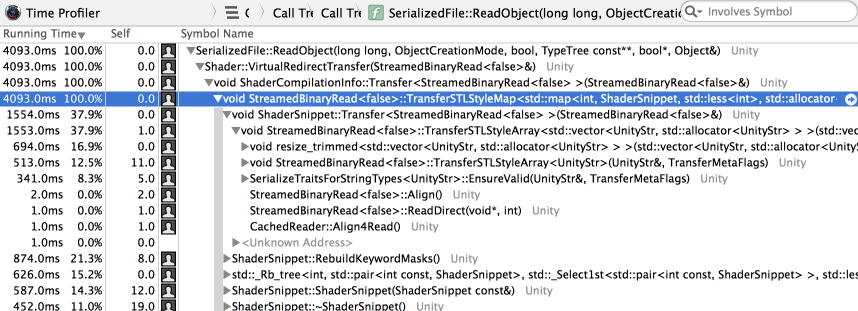
Profiling shader load time also says that most of the time ends up being spent on loading editor related data that is arrays of arrays of strings and so on:

I could have picked functions from the profiler results, went though each of them and optimized, and perhaps would have achieved a solid 2-3x improvement over initial results. Very often that’s enough to be proud!

However…

Taking a step back

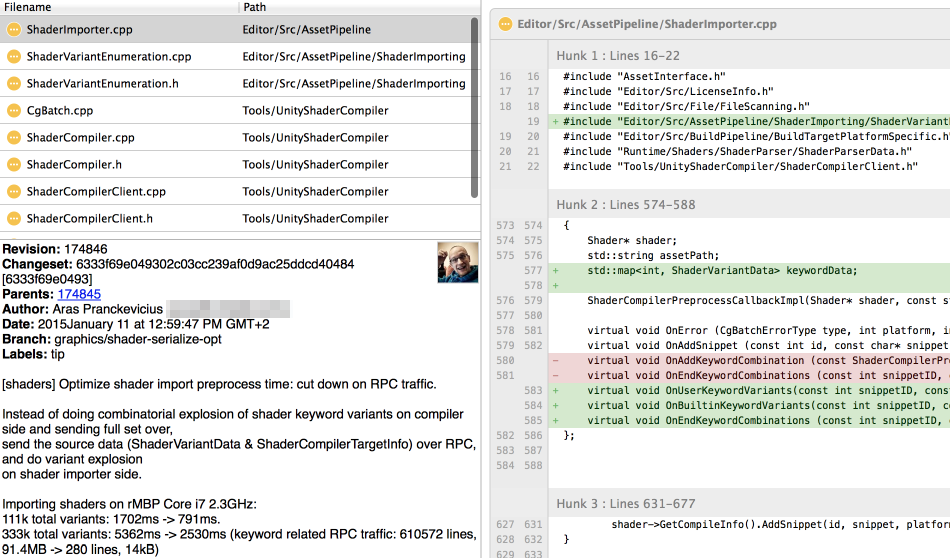
Or like Mike Acton would say, “look at your data!” (check his CppCon2014 slides or video). Another saying is also applicable: “think!

Why do we have this problem to begin with?

For example, in 333k variant shader case, we end up sending 610560 lines of shader variant information between shader compiler process & editor, with macro strings in each of them. In total we’re sending 91 megabytes of data over RPC pipe during shader import.

One possible area for improvement: the data we send over and store in imported shader data is a small set of macro strings repeated over and over and over again. Instead of sending or storing the strings, we could just send the set of strings used by a shader once, assign numbers to them, and then send & store the full set as lists of numbers (or fixed size bitmasks). This should cut down on the amount of string operations we do (massively cut down on number of small allocations), size of data we send, and size of data we store.

Another possible approach: right now we have source data in shader that indicate which variants to generate. This data is very small: just a list of on/off features, and some built-in variant lists (“all variants to handle lighting in forward rendering”). We do the full combinatorial explosion of that in the shader compiler process, send the full set over to the editor, and the editor stores that in imported shader data.

But the way we do the “explosion of source data into full set” is always the same. We could just send the source data from shader compiler to the editor (a very small amount!), and furthermore, just store that in imported shader data. We can rebuild the full set when needed at any time.

Changing the data

So let’s try to do that. First let’s deal with RPC only, without changing serialized shader data. A few commits later…

This made shader importing over twice as fast!

Shader   Import
   27k    419ms ->  200ms
  111k   1702ms ->  791ms
  333k   5362ms -> 2530ms
    1M  16784ms -> 8280ms

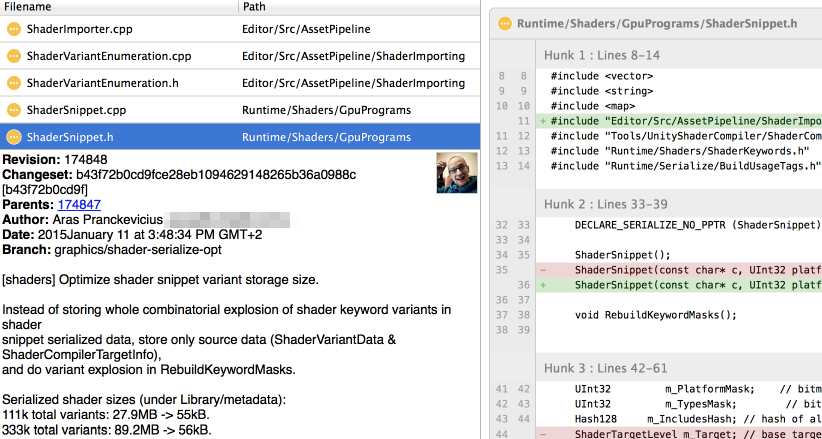
Let’s do the other part too; where we change serialized shader variant data representation. Instead of storing full set of possible variants, we only store data needed to generate the full set:

Shader   Import              Load                 Size
   27k    200ms ->   285ms    103ms ->    396ms     6.4MB -> 55kB
  111k    791ms ->  1229ms    426ms ->   1832ms    27.9MB -> 55kB
  333k   2530ms ->  3893ms   1410ms ->   5892ms    89.2MB -> 56kB
    1M   8280ms -> 12416ms   4498ms ->  18949ms   272.4MB -> 57kB

Everything seems to work, and the serialized file size got massively decreased. But, both importing and loading got slower?! Clearly I did something stupid. Profile!

Right. So after importing or loading the shader (from now a small file on disk), we generate the full set of shader variant data. Which right now is resulting in a lot of string allocations, since it is generating arrays of arrays of strings or somesuch.

But we don’t really need the strings at this point; for example after loading the shader we only need the internal representation of “shader variant key” which is a fairly small bitmask. A couple of tweaks to fix that, and we’re at:

Shader  Import    Load
   27k    42ms     7ms
  111k    47ms    27ms
  333k    94ms    76ms
    1M   231ms   225ms

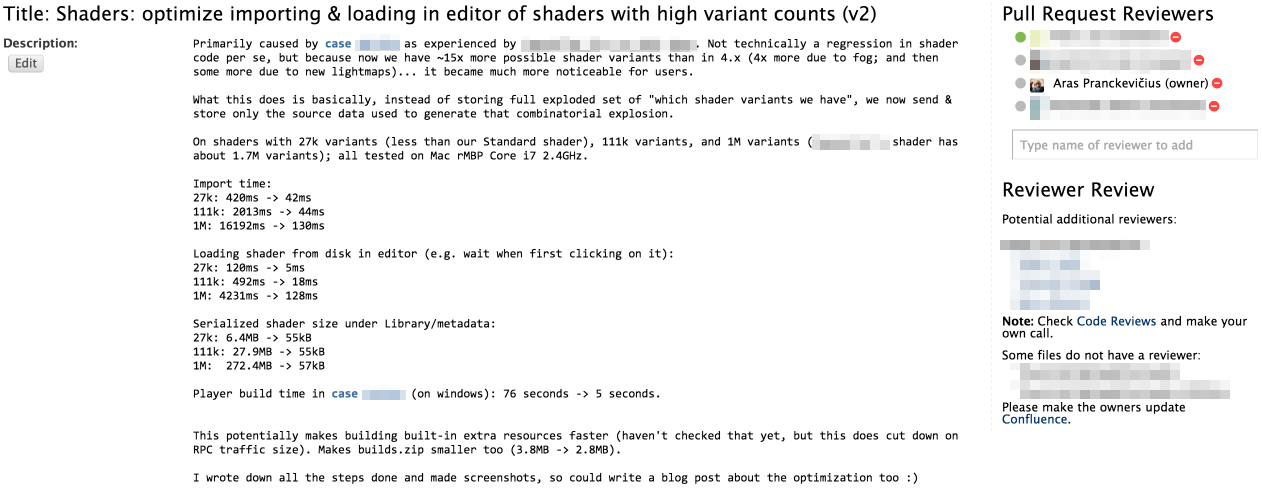
Look at that! Importing a 333k variant shader got 82 times faster; loading its metadata got22 times faster, and the imported file size got over a thousand times smaller!

One final look at the profiler, just because:

Weird, time is spent in memory allocation but there shouldn’t be any at this point in that function; we aren’t creating any new strings there. Ahh, implicit std::string to UnityStr (our own string class with better memory reporting) conversion operators (long story…). Fix that, and we’ve got another 2x improvement:

Shader  Import    Load
   27k    42ms     5ms
  111k    44ms    18ms
  333k    53ms    46ms
    1M   130ms   128ms

The code could still be optimized further, but there ain’t no easy fixes left I think. And at this point I’ll have more important tasks to do…

What we’ve got

So in total, here’s what we have so far:

Shader   Import                Load                 Size
   27k    420ms-> 42ms (10x)    120ms->  5ms (24x)    6.4MB->55kB (119x)
  111k   2013ms-> 44ms (46x)    492ms-> 18ms (27x)   27.9MB->55kB (519x)
  333k   7779ms-> 53ms (147x)  1719ms-> 46ms (37x)   89.2MB->56kB (this is getting)
    1M  16192ms->130ms (125x)  4231ms->128ms (33x)  272.4MB->57kB (ridiculous!)

And a fairly small pull request to achieve all this (~400 lines of code changed, ~400 new added):

Overall I’ve probably spent something like 8 hours on this – hard to say exactly since I did some breaks and other things. Also I was writing down notes & making sceenshots for the blog too :) The fix/optimization is already in Unity 5.0 beta 20 by the way.

Conclusion

Apple’s Instruments is a nice profiling tool (and unlike xperf, the UI is not intimidating…).

However, Profiler Is Not A Replacement For Thinking! I could have just looked at the profiling results and tried to optimize “what’s at top of the profiler” one by one, and maybe achieved 2-3x better performance. But by thinking about the actual problem and why it happens, I got a way, way better result.

Happy thinking!

Random Thoughts on New Explicit Graphics APIs

$
0
0

Last time I wrote about graphics APIs wasalmost a year ago. Since then,Apple Metal was unveiled and shipped in iOS 8; as well as Khronos Vulkan was announced (which is very muchAMD Mantle, improved to make it cross-vendor). DX12 continues to be developed for Windows 10.

@promit_roy has avery good post on gamedev.net about why these new APIs are needed and what problems do they solve. Go read it now, it’s good.

Just a couple more thoughts I’d add.

Metal experience

When I wrote the previous OpenGL rant, we already were working on Metal and had it “basically work in Unity”. I’ve only ever worked on PC/mobile graphics APIs before (D3D9, D3D11, OpenGL/ES, as well as D3D7-8 back in the day), so Metal was the first of these “more explicit APIs” I’ve experienced (I never actually did anything on consoles before, besides just seeing some code).

ZOMG what a breath of fresh air.

Metal is super simple and very, very clear. I was looking at the header files and was amazed at how small they are – “these few short files, and that’s it?! wow.” A world of difference compared to how much accumulated stuff is in OpenGL core & extension headers (to a lesser degree in OpenGL ES too).

Conceptually Metal is closer to D3D11 than OpenGL ES (separate shader stages; constant buffers; same coordinate conventions), so “porting Unity to it” was mostly taking D3D11 backend (which I did back in the day too, so familiarity with the code helped), changing the API calls and generally removing stuff.

Create a new buffer (vertex, index, constant - does not matter) – one line of code (MTLDevice.newBuffer*). Then just get a pointer to data and do whatever you want. No mapping, no locking, no staging buffers, no trying to nudge the API into doing the exact type of buffer update you want (on the other hand, data synchronization is your own responsibility now).

And even with the very early builds we had, everything more or less “just worked”, with a super useful debug & validation layer. Sure there were issues and there were occasional missing things in the early betas, but nothing major and the issues got fixed fast.

To me Metal showed that a new API that gets rid of the baggage and exposes platform strengths is a very pleasant thing to work with. Metal is essentially just several key ideas (many of which are shared by other “new APIs” like Vulkan or DX12):

  • Command buffer creation is separate from submission; and creation is mostly stateless (do that from any thread).
  • Whole rendering pipeline state is specified, thus avoiding “whoops need to revalidate & recompile shaders” issues.
  • Unified memory; just get a pointer to buffer data. Synchronization is your own concern.

Metal very much keeps the existing resource binding model from D3D11/OpenGL - you bind textures/buffers to shader stage “resource slots”.

I think of all public graphics APIs (old ones like OpenGL/D3D11 and new ones like Vulkan/DX12), Metal is probably the easiest to learn. Yes it’s very much platform specific, but again, OMG so easy.

Partially because it keeps the traditional binding model – while that means Metal can’t do fancy things like bindless resources, it also means the binding model is simple. I would not want to be a student learning graphics programming, and having to understand Vulkan/DX12 resource binding.

Explicit APIs and Vulkan

This bit from Promit’s post,

But there’s a very real message that if these APIs are too challenging to work with directly, well the guys who designed the API also happen to run very full featured engines requiring no financial commitments.

I love conspiracy theories as much as the next guy, but I don’t think that’s quite true. If I’d put my cynical hat on, then sure: making graphics APIs hard to use is an interest of middleware providers. You could also say that making sure there are lots of different APIs is an interest of middleware providers too! The harder it is to make things, the better for them, right.

In practice I think we’re all too much hippies to actually think that way. I can’t speak for Epic, Valve or Frostbite of course, but on Unity side it was mostlyChristophe being involved in Vulkan, and if you think his motivation is commercial interest then you don’t know him :) I and others from graphics team were only very casually following the development – I would have loved to be more involved, but was 100% busy on Unity 5.0 development all the time.

So there.

That said, to some extent the explicit APIs (both Vulkan and DX12) are harder to use. I think it’s mostly due to more flexible (but much more complicated) resource binding model. See Metal above - my opinion is that stateless command buffer creation and fully specified pipeline state actually make it easier to use the API. But new way of resource binding and to some extent ability to reuse & replay command buffer chunks (which Metal does not have either) does complicate things.

However, I think this is worth it. The actual lowest level of API should be very efficient, even if somewhat “hard to use” (or require an expert to use it). Additional “ease of use” layers can be put on top of that! The problem with OpenGL was that it was trying to do both at once, with a very sad side effect that everyone and their dog had to implement all the layers (in often subtly incompatible ways).

I think there’s plenty of space for “somewhat abstacted” libraries or APIs to be layered on top of Vulkan/DX12. Think XNA back when it was a thing; or three.js in WebGL world. Orbgfx in the C++ world. These are all good and awesome.

Let’s see what happens!

Optimizing Unity Renderer Part 1: Intro

$
0
0

At work we formed a small “strike team” for optimizing CPU side of Unity’s rendering. I’ll blog about my part as I go (idea of doing that seems to be generally accepted). I don’t know where that will lead to, but hey that’s part of the fun!

Backstory / Parental Warning

I’m going to be harsh and say “this code sucks!” in a lot of cases. When trying to improve the code, you obviously want to improve what is bad, and so that is often the focus. Does not mean the codebase in general is that bad, or that it can’t be used for good things! Just this March, we’ve got Pillars of Eternity,Ori and the Blind Forest andCities: Skylines among top rated PC games; all made with Unity. Not too bad for “that mobile engine that’s only good for prototyping”, eh.

The truth is, any codebase that grows over long period of time and is worked on by more than a handful of people is very likely“bad” in some sense. There are areas where code is weird; there are places that no one quite remembers how or why they work; there are decisions done many years ago that don’t quite make sense anymore, and no one had time to fix yet. In a big enough codebase, no single person can know all the details about how it’s supposed to work, so some decisions clash with some others in subtle ways. Paraphrasing someone, “there are codebases that suck, and there are codebases that aren’t used” :)

It is important to try to improve the codebase though! Always keep on improving it. We’ve done lots of improvements in all the areas, but frankly, the rendering code improvements over last several years have been very incremental, without anyone taking a hard look at the whole of it and focusing on just improving it as a fulltime effort. It’s about time we did that!

A number of times I’d point at some code and say “ha ha! well that is stupid!”. And it was me who wrote it in the first place. That’s okay. Maybe now I know better; or maybe the code made sense at the time; or maybe the code made sense considering the various factors (lack of time etc.). Or maybe I just was stupid back then. Maybe in five years I’ll look at my current code and say just as much.

Anyway…

Wishlist

In pictures, here’s what we want to end up with. A high throughput rendering system, working without bottlenecks.

Animated GIFs aside, here’s the “What is this?” section pretty much straight from our work wiki:

Current (Unity 5.0) rendering, shader runtime & graphics API CPU code is NotTerriblyEfficient™. It has several issues, and we want to address as much of that as possible:

  • GfxDevice (our rendering API abstraction):
    • Abstraction is mostly designed around DX9 / partially-DX10 concepts. E.g. constant/uniform buffers are a bad fit now.
    • A mess that grew organically over many years; there are places that need a cleanup.
    • Allow parallel command buffer creation on modern APIs (like consoles, DX12, Metal or Vulkan).
  • Rendering loops:
    • Lots of small inefficiencies and redundant decisions; want to optimize.
    • Run parts of loops in parallel and/or jobify parts of them. Using native command buffer creation API where possible.
    • Make code simpler & more uniform; factor out common functionality. Make more testable.
  • Shader / Material runtime:
    • Data layout in memory is, uhm, “not very good”.
    • Convoluted code; want to clean up. Make more testable.
    • “Fixed function shaders” concept should not exist at runtime. See [Generating Fixed Function Shaders at Import Time].
    • Text based shader format is stupid. See [Binary Shader Serialization].

Constraints

Whatever we do to optimize / cleanup the code, we should keep the functionality working as much as possible. Some rarely used functionality or corner cases might be changed or broken, but only as a last resort.

Also one needs to consider that if some code looks complicated, it can be due to several reasons. One of them being “someone wrote too complicated code” (great! simplify it). Another might be “there was some reason for the code to be complex back then, but not anymore” (great! simplify it).

But it also might be that the code is doing complex things, e.g. it needs to handle some tricky cases. Maybe it can be simplified, but maybe it can’t. It’s very tempting to start “rewriting something from scratch”, but in some cases your new and nice code might grow complicated as soon as you start making it do all the things the old code was doing.

The Plan

Given a piece of CPU code, there are several axes of improving its performance: 1) “just making it faster” and 2) make it more parallel.

I thought I’d focus on “just make it faster” initially. Partially because I also want to simplify the code and remember the various tricky things it has to do. Simplifying the data, making the data flows more clear and making the code simpler often also allows doing step two (“make it more parallel”) easier.

I’ll be looking at higher level rendering logic (“rendering loops”) and shader/material runtime first, while others on the team will be looking at simplifying and sanitizing rendering API abstraction, and experimenting with “make it more parallel” approaches.

For testing rendering performance, we’re gonna need some actual content to test on. I’ve looked at several game and demo projects we have, and made them be CPU limited (by reducing GPU load - rendering at lower resolution; reducing poly count where it was very large; reducing shadowmap resolutions; reducing or removing postprocessing steps; reducing texture resolutions). To put higher load on the CPU, I duplicated parts of the scenes so they have way more objects rendered than originally.

It’s very easy to test rendering performance on something like “hey I have these 100000 cubes”, but that’s not a very realistic use case. “Tons of objects using exact same material and nothing else” is a very different rendering scenario from thousands of materials with different parameters, hundreds of different shaders, dozens of render target changes, shadowmap & regular rendering, alpha blended objects, dynamically generated geometry etc.

On the other hand, testing on a “full game” can be cumbersome too, especially if it requires interaction to get anywhere, is slow to load the full level, or is not CPU limited to begin with.

When testing for CPU performance, it helps to test on more than one device. I typically test on a development PC in Windows(currently Core i7 5820K), on a laptop in Mac (2013 rMBP) and on whatever iOS device I have around (right now, iPhone 6). Testing on consoles would be excellent for this task; I keep on hearing they have awesome profiling tools, more or less fixed clocks and relatively weak CPUs – but I’ve no devkits around. Maybe that means I should get one.

The Notes

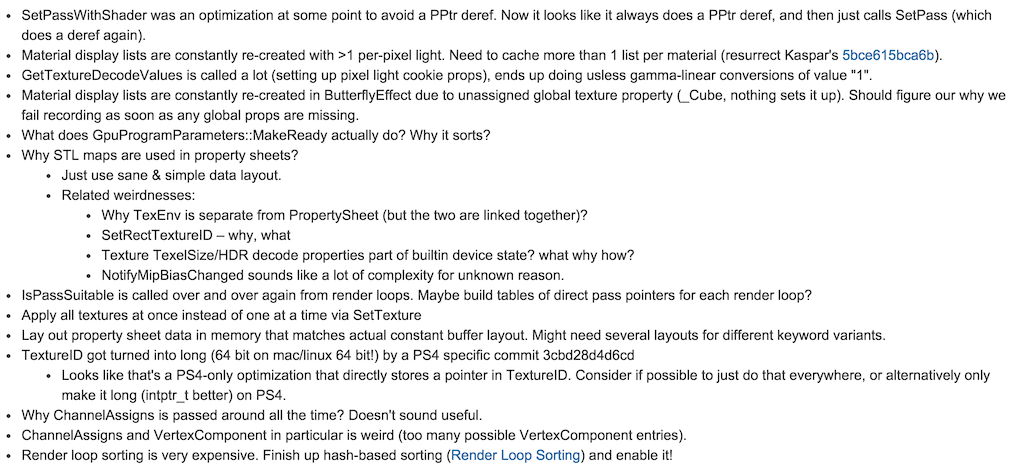
Next up, I ran the benchmark projects and looked at profiler data (both Unity profiler and 3rd party profilers like Sleepy/Instruments), and also looked at the code to see what it is doing. At this point whenever I see something strange I just write it down for later investigation:

Some of the weirdnesses above might have valid reasons, in which case I go and add code comments explaining them. Some might have had reasons once, but not anymore. In both cases source control log / annotate functionality is helpful, and asking people who wrote the code originally on why something is that way. Half of the list above is probably because I wrote it that way many years ago, which means I have to remember the reason(s), even if they are “it seemed like a good idea at the time”.

So that’s the introduction. Next time, taking some of the items from the above “WAT?” list and trying to do something about them!

Update: next blog post is up. Part 2: Cleanups.

Optimizing Unity Renderer Part 2: Cleanups

$
0
0

With the story introduction in the last post, let’s get to actual work now!

As already alluded in the previous post, first I try to remember / figure out what the existing code does, do some profiling and write down things that stand out.

Profiling on several projects mostly reveals two things:

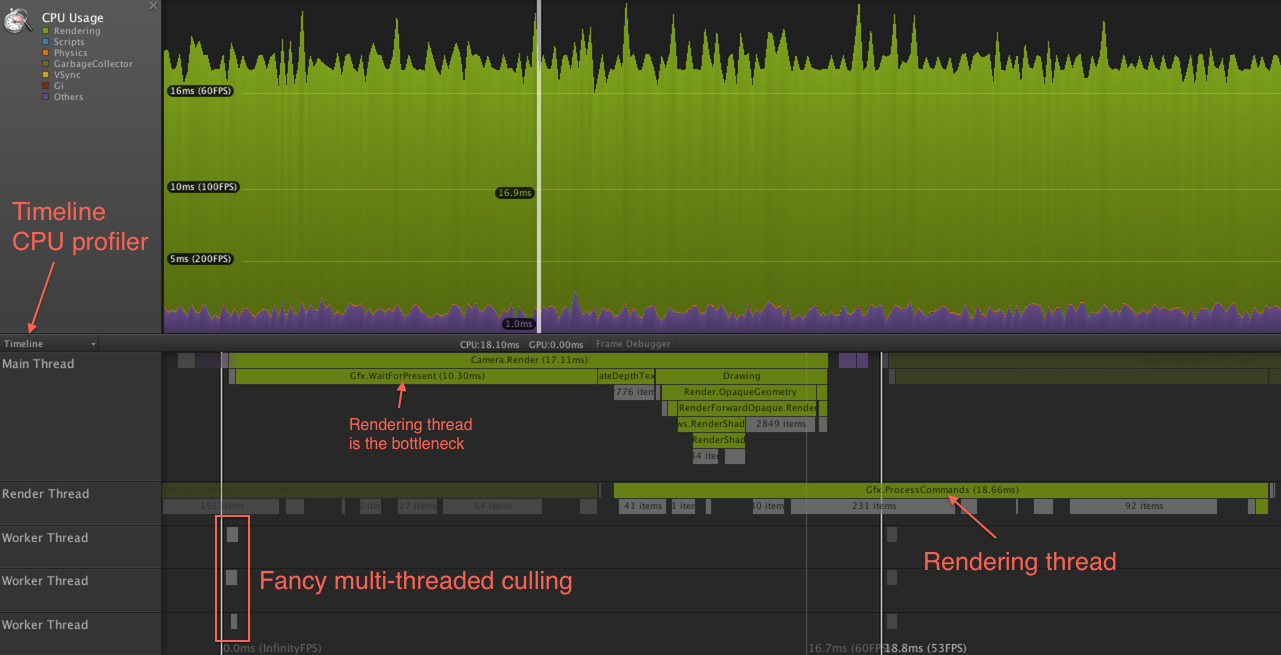
1) Rendering code could really use wider multithreading than “main thread and render thread” that we have now. Here’s one capture from Unity 5 timeline profiler:

In this particular case, CPU bottleneck is the rendering thread, where majority of the time it just spends in glDrawElements (this was on a MacBookPro; GPU-simplified scene from Butterfly Effect demo doing about 6000 draw calls). Main thead just ends up waiting for the render thread to catch up. Depending on the hardware, platform, graphics API etc. the bottleneck can be elsewhere, for example the same project on a much faster PC under DX11 is spending about the same time in main vs. rendering thread.

The culling sliver on the left side looks pretty good, eventually we want all our rendering code to look like that too. Here’s the culling part zoomed in:

2) There are no “optimize this one function, make everything twice as fast” places :( It’s going to be a long journey of rearranging data, removing redundant decisions, removing small things here and there until we can reach something like“2x faster per thread”. If ever.

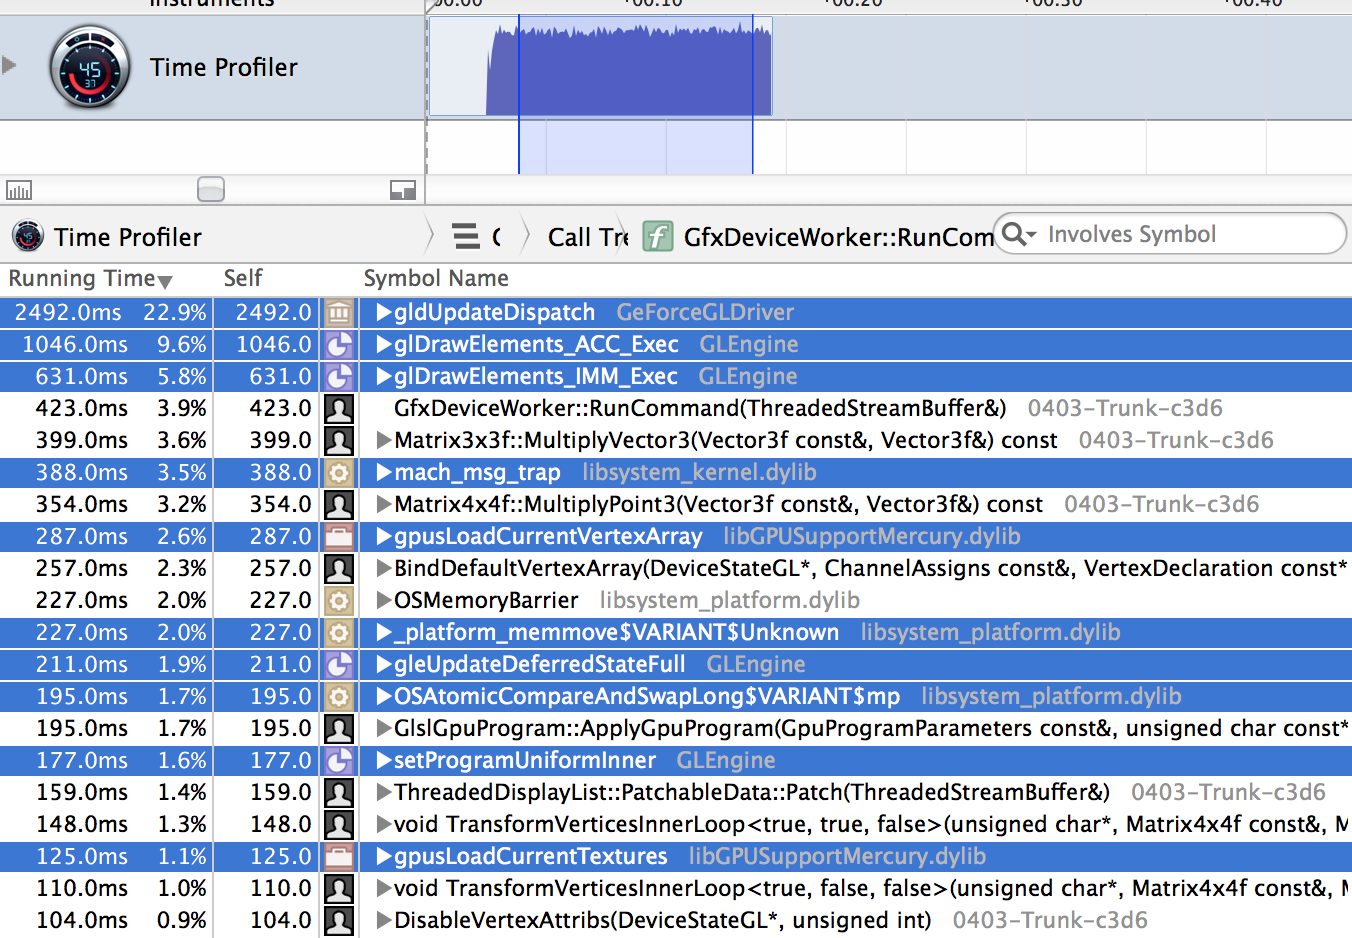
The rendering thread profiling data is not terribly interesting here. Majority of the time (everything highlighted below) is from OpenGL runtime/driver. Adding a note that perhaps we do something stupid that is causing the driver to do too much work (I dunno, switching between different vertex layouts for no good reason etc.), but otherwise not much to see on our side. Most of the remaining time is spent in dynamic batching.

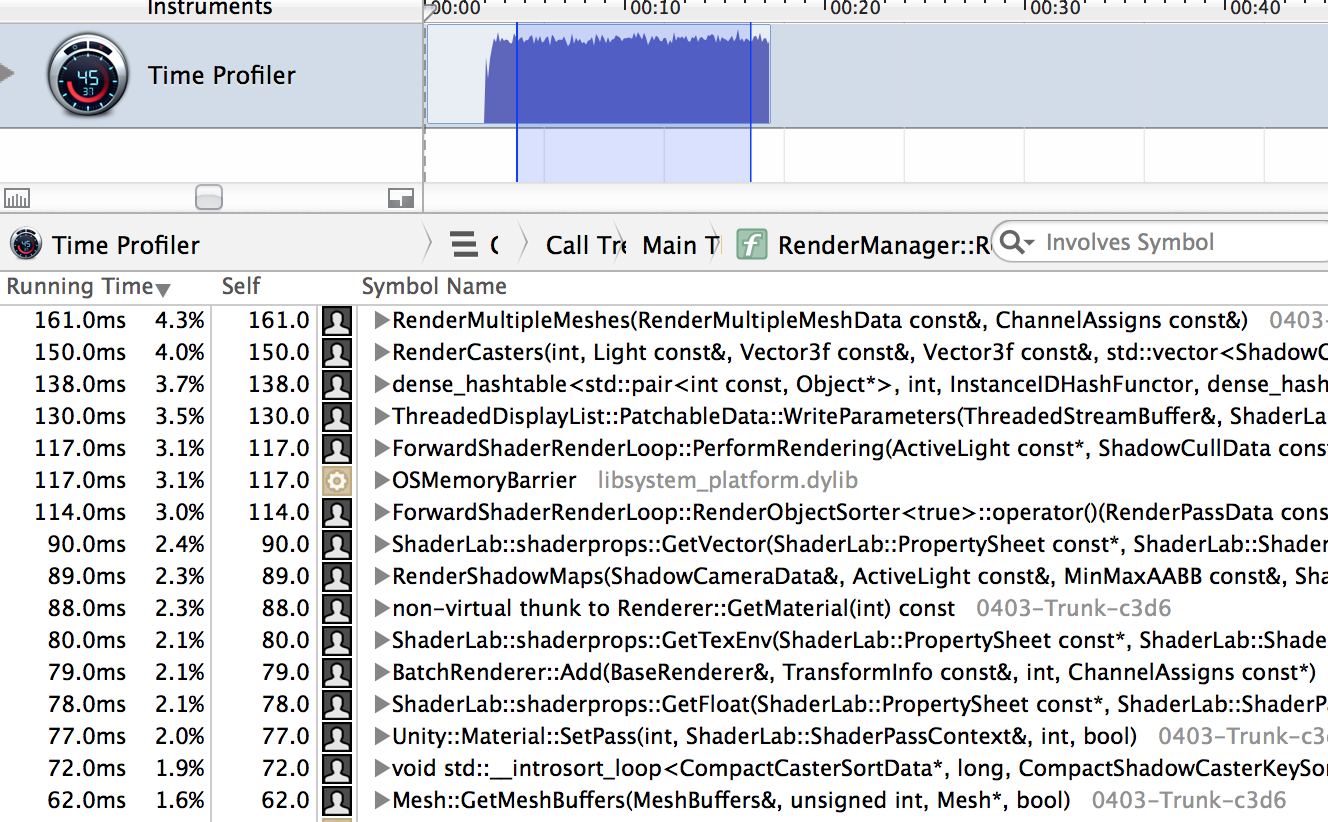
Looking into the functions heavy on the main thread, we get this:

Now there are certainly questions raised (why so many hashtable lookups? why sorting takes so long? etc., see list above), but the point is, there’s no single place where optimizing something would give magic performance gains and a pony.

Observation 1: material “display lists” are being re-created often

In our code, a Material can pre-record what we call a “display list” for the rendering thread. Think of it as a small command buffer, where a bunch of commands (“set this raster state object, set this shader, set these textures”) are stored. Most important thing about them: they are stored with all the parameters (final texture values, shader uniform values etc.) resolved. When “applying” a display list, we just hand it off to the rendering thread, no need to chase down material property values or other things.

That’s all well and good, except when something changes in the material that makes the recorded display list invalid. In Unity, each shader internally often is many shader variants, and when switching to a different shader variant, we need to apply a different display list. If the scene was setup in such a way that caused the same Materials to alternate between different lists, then we have a problem.

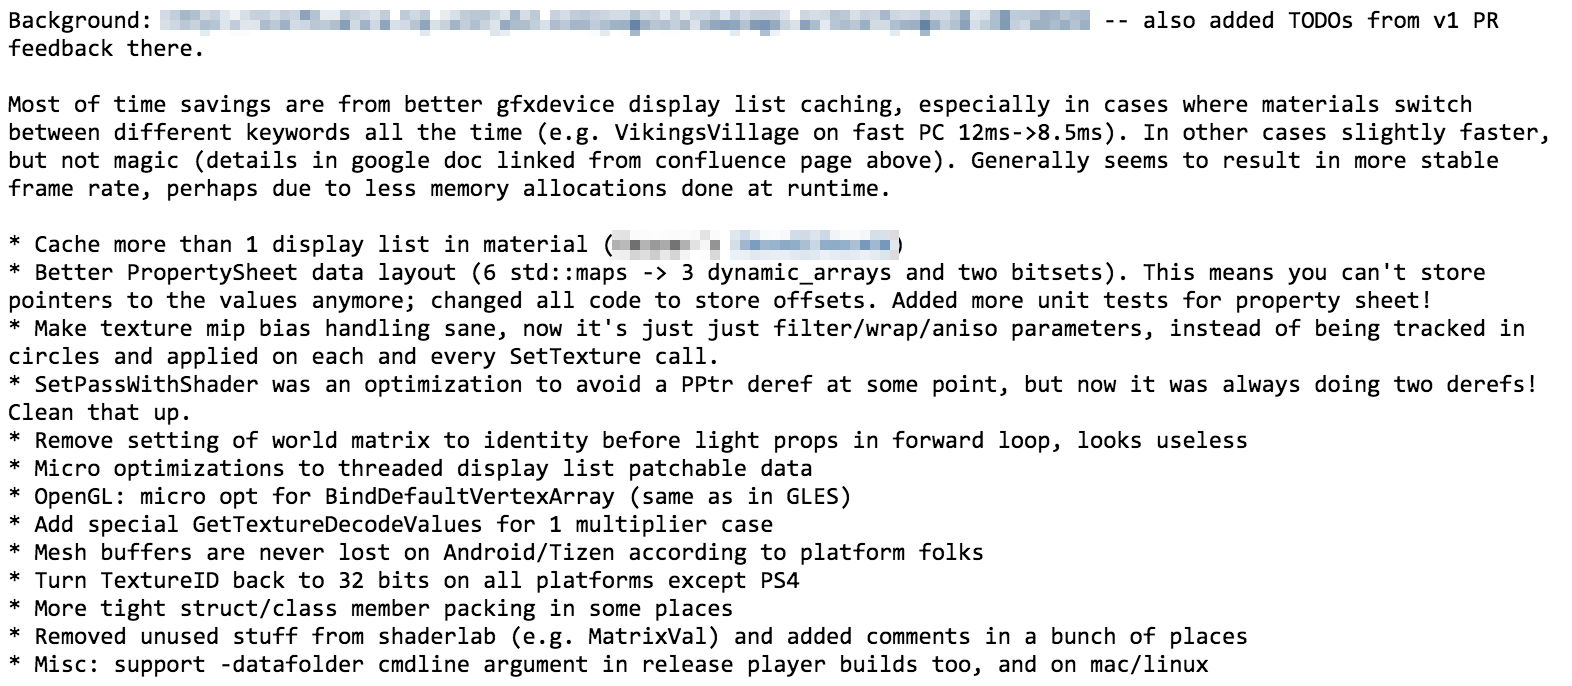
Which was exactly what was happening in several of the benchmark projects I had; short story being “multiple per-pixel lights in forward rendering cause this”. Turns out we had code to fix this on some branch, it just needed to be finished up – so I found it, made to compile in the current codebase and it pretty much worked. Now the materials can pre-record more than one “display list” in them, and that problem goes away.

On a PC (Core i7 5820K), one scene went from 9.52ms to 7.25ms on the main thread which is fairly awesome.

Spoilers ahead: this change is the one that brought the largest benefit on the affected scenes, from everything I did over almost two weeks. And it wasn’t even the code that “I wrote”; I just fished it out from a somewhat neglected branch. So, yay! An easy change for a 30% performance gain! And bummer, I will not get this kind of change from anything written below.

Observation 2: too many hashtable lookups

Next from the observations list above, looked into “why so many hashtable lookups” question (if there isn’ta song about it yet, there should be!).

In the rendering code, many years ago I added something like Material::SetPassWithShader(Shader* shader, ...) since the calling code already knows with which shader material state should be setup with. Material also knows it’s shader, but it stores something we call a PPtr (“persistent pointer”) which is essentially a handle. Passing the pointer directly avoids doing a handle->pointer lookup (which currently is a hashtable lookup since for various complicated reasons it’s hard to do an array-based handle system, I’m told).

Turns out, over many changes, somehow Material::SetPassWithShader ended up doing two handle->pointer lookups, even if it already got the actual shader pointer as a parameter! Fixed:

Ok so this one turned out to be good, measurable and very easy performance optimization. Also made the codebase smaller, which is a very good thing.

Small tweaks here and there

From the render thread profiling on a Mac above, our own code in BindDefaultVertexArray was taking 2.3% which sounded excessive. Turns out, it was looping over all possible vertex component types and checking some stuff; made the code loop only over the vertex components used by the shader. Got slightly faster.

One project was calling GetTextureDecodeValues a lot, which compute some color space, HDR and lightmap decompression constants for a texture. It was doing a bunch of complicated sRGB math on an optional “intensity multiplier” parameter which was set to exactly 1.0 in all calling places except one. Recognizing that in the code made a bunch of pow() calls go away. Added to a“look later” list: why we call that function very often in the first place?

Some code in rendering loops that was figuring out where draw call batch boundaries need to be put (i.e. where to switch to a new shader etc.), was comparing some state represented as separate bools. Packed a bunch of them into bitfields and did comparisons on one integer. No observable performance gains, but the code actually ended up being smaller, so a win :)

Noticed that figuring out which vertex buffers and vertex layouts are used by objects queries Mesh data that’s quite far apart in memory. Reordered data based on usage type (rendering data, collision data, animation data etc.).

Also reduced data packing holes using @msinilo’s excellentCruncherSharp(and did sometweaks to it along the way :)) I hear there’s a similar tool for Linux (pahole). On a Mac there’sstruct_layout but it was taking forever on Unity’s executable and the Python script often would fail with some recursion overflow exception.

While browsing through the code, noticed that the way we track per-texture mipmap bias is very convoluted, to put it mildly. It is set per-texture, then the texture tracks all the material property sheets where it’s being used; notifies them upon any mip bias change, and the bias is fetched from property sheets and applied together with the texture each and every time a texture is set on a graphics device. Geez. Fixed. Since this changed interface of our graphics API abstraction, this means changing all 11 rendering backends; just a few fairly trivial changes in each but can feel intimidating (I can’t even build half of them locally). No fear, we have the build farm to check for compile errors, and the test suites to check for regressions!

No significant performance difference, but it feels good to get rid of all that complexity. Adding to a“look later” list: there’s one more piece of similar data that we track per-texture; something about UV scaling for non-power-of-two textures. I suspect it’s there for no good reason these days, gotta look and remove it if possible.

And some other similar localized tweaks, each of them is easy and makes some particular place a tiny bit better, but does not result in any observable performance improvement. Maybe doing a hundred of them would result in some noticable effect, but it’s much more possible that we’ll need some more serious re-working of things to get good results.

Data layout of Material property sheets

One thing that has been bothering me is how we store material properties. Each time I’d show the codebase to a new engineer, in that place I’d roll my eyes and say “and yeah, here we store the textures, matrices, colors etc. of the material, in separate STL maps. The horror. The horror.“.

There’s this popular thought that C++ STL containers have no place in high performance code, and no good game has ever shipped with them (not true), and if you use them you must be stupid and deserve to be ridiculed (I don’t know… maybe?). So hey, how about I go and replace these maps with a better data layout? Must make everything a million times better, right?

In Unity, parameters to shaders can come from two places: either from per-material data, or from “global” shader parameters. Former is typically for things like “diffuse texture”, while the latter is for things like “fog color” or “camera projection”(there’s slight complication with per-instance parameters in form ofMaterialPropertyBlock etc., but let’s ignore that for now).

The data layout we had before was roughly this (PropertyName is basically an integer):

map<PropertyName, float> m_Floats;
map<PropertyName, Vector4f> m_Vectors;
map<PropertyName, Matrix4x4f> m_Matrices;
map<PropertyName, TextureProperty> m_Textures;
map<PropertyName, ComputeBufferID> m_ComputeBuffers;
set<PropertyName> m_IsGammaSpaceTag; // which properties come as sRGB values

What I replaced it with (simplified, only showing data members; dynamic_array is very much like std::vector, but more EASTL style):

struct NameAndType { PropertyName name; PropertyType type; };

// Data layout:
// - Array of name+type information for lookups (m_Names). Do
//   not put anything else; only have info needed for lookups!
// - Location of property data in the value buffer (m_Offsets).
//   Uses 4 byte entries for smaller data; don't use size_t!
// - Byte buffer with actual property values (m_ValueBuffer).
// - Additional data per-property in m_GammaProps and
//   m_TextureAuxProps bit sets.
//
// All the arrays need to be kept in sync (sizes the same; all
// indexed by the same property index).
dynamic_array<NameAndType> m_Names;
dynamic_array<int> m_Offsets;
dynamic_array<UInt8> m_ValueBuffer;

// A bit set for each property that should do gamma->linear
// conversion when in linear color space
dynamic_bitset m_GammaProps;
// A bit set for each property that is aux for a texture
// (e.g. *_ST for texture scale/tiling)
dynamic_bitset m_TextureAuxProps;

When a new property is added to the property sheet, it is just appended to all the arrays. Property name/type information and property location in the data buffer are kept separate so that when searching for properties, we don’t even fetch the data that’s not needed for the search itself.

Biggest external change is that before, one could find a property value and store a direct pointer to it (was used in the pre-recorded material display lists, to be able to “patch in” values of global shader properties before replaying them). Now the pointers are invalidated whenever resizing the arrays; so all the code that was possibly storing pointers has to be changed to store offsets into the property sheet data instead. So in the end this was quite some code changes.

Finding properties has changed from being an O(logN) operation (map lookup) into an O(N) operation (linear scan though the names array). This sounds bad if you’re learning computer science as it is typically taught. However, I looked at various projects and found that typically the property sheets contain between 5 and 30 properties in total (most often around 10); and a linear scan with all the search data right next to each other in memory is not that bad compared to STL map lookup where the map nodes can be placed arbitrarily far away from one another (if that happens, each node visit can be a CPU cache miss). From profiling on several different projects, the part that does “search for properties” was consistently slightly faster on a PC, a laptop and an iPhone.

Did this change brought magic performance improvements though? Nope. It brought a small improvement in average frame time and slightly smaller memory consumption, especially when there are lots of different materials. But does “just replace STL maps with packed arrays” result in magic? Alas, no. Well, at least I don’t have to be roll my eyes anymore when showing this code to people, so there’s that.

Upon my code review, one comment that popped up is that I should try splitting up property data so that properties of the same type are grouped together. A property sheet could know which start and end index is for a particular type, and then searching for a particular property would only need to scan the names array of that type (and the array would only contain an integer name per property, instead of name+type). Adding a new property into the sheet would become more expensive, but looking them up cheaper.

A side note from all this: modern CPUs are impressively fast at what you could call “bad code”, and have mightily large caches too. I wasn’t paying much attention to mobile CPU hardware, and just realized that iPhone 6 CPU has a 4 megabyte L3 cache. Four. Megabytes. On a phone. That’s about how much RAM my first PC had!

Results so far

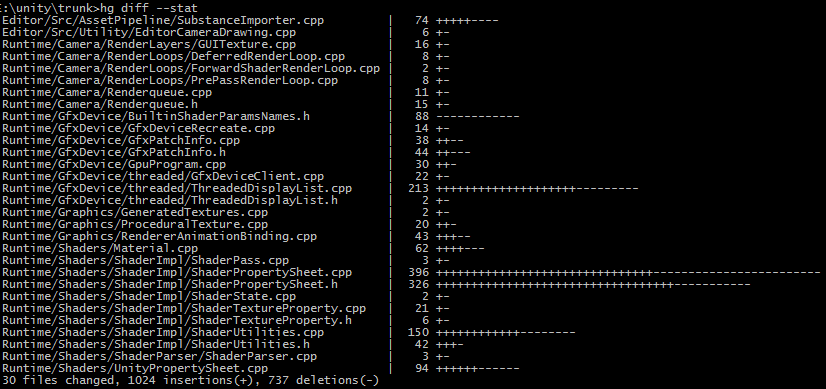
So that was about 2 weeks of work (I’d estimate at 75% time - the rest spent on unrelated bugfixes, code reviews, etc.); with a state where all the platforms are building and tests are passing; and a pull request ready. 40 commits, 135 files, about 2000 lines of code changed.

Performance wise, one benchmark project improved a lot (the one most affected by “display lists being re-created” issue), with total frame time 11.8ms -> 8.50ms on PC; and 29.2ms -> 26.9ms on a laptop. Other projects improved, but nowhere near as much (numbers like 7.8ms -> 7.3ms on PC; another project 15.2ms -> 14.1ms on iPhone etc.).

Most of the performance improvements came from two places really (display list re-creation; and avoiding useless hashtable lookups). Not sure how to feel about the rest of the changes - it feels like they are good changes overall, if only because I now have a better understanding of the codebase, and have added quite many comments explaining what & why. I also now have an even longer list of “here are the places that are weird or should be improved”.

Is spending almost two weeks worth the results I got so far? Hard to say. Sometimes I do have a week where it feels like I did nothing at all, so it’s better than that :)

Overall I’m still not sure if “optimizing stuff” is my strong area. I think I’m pretty good at only a few things: 1) debugging hard problems – I can come up with plausible hypotheses and ways to divide-and-conquer the problem fast; 2) understanding implications of some change or a system – what other systems will be affected and what could/would be problematic interactions; and 3) having good ambient awareness of things done by others in the codebase – I can often figure out when several people are working on somewhat overlapping stuff and tell them “yo, you two should coordinate”.

Is any of that a useful skill for optimization? I don’t know. I certainly can’t juggle instruction latencies and execution ports and TLB misses in my head. But maybe I’ll get better at it if I practice? Who knows.

Not quite sure which path to go next at the moment; I see at least several possible ways:

  1. Continue doing incremental improvements, and hope that net effect of a lot of them will be good. Individually each of them is a bit disappointing since the improvement is hard to measure.
  2. Start looking at the bigger picture and figure out how we can avoid a lot of currently done work completely, i.e. more serious “reshaping” of how things are structured.
  3. Once some more cleanup is done, switch to helping others with “multithread more stuff” approaches.
  4. Optimization is hard! Let’s play more Rocksmith until situation improves.

I guess I’ll discuss with others and do one or more of the above. Until next time!

Update: Part 3: Fixed Function Removal is up.

Optimizing Unity Renderer Part 3: Fixed Function Removal

$
0
0

Last time I wrote about some cleanups and optimizations. Since then, I got sidetracked into doing some Unity 5.1 work, removing Fixed Function Shaders and other unrelated things. So not much blogging about optimization per se.

Fixed Function What?

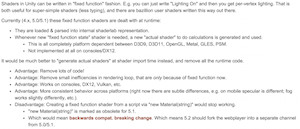
Once upon a time, GPUs did not have these fancy things called “programmable shaders”; instead they could be configured in more or less (mostly less) flexible ways, by enabling and disabling certain features. For example, you could tell them to calculate some lighting per-vertex; or to add two textures together per-pixel.

Unity started out a long time ago, back when fixed function GPUs were still a thing; so naturally it supports writing shaders in this fixed function style (“shaderlab” in Unity lingo). The syntax for them is quite easy, and actually they are much faster to write than vertex/fragment shader pairs if all you need is some simple shader.

For example, a Unity shader pass that turns on regular alpha blending, and outputs texture multiplied by material color, is like this:

Pass
{
	Blend SrcAlpha OneMinusSrcAlpha
	SetTexture [_MainTex] { constantColor[_Color] combine texture * contant }
}

compare that with a vertex+fragment shader that does exactly the same:

Pass
{
	Blend SrcAlpha OneMinusSrcAlpha
	CGPROGRAM
	#pragma vertex vert
	#pragma fragment frag
	#include "UnityCG.cginc"
	struct v2f
	{
		float2 uv : TEXCOORD0;
		float4 pos : SV_POSITION; 
	};
	float4 _MainTex_ST;
	v2f vert (float4 pos : POSITION, float2 uv : TEXCOORD0)
	{
		v2f o;
		o.pos = mul(UNITY_MATRIX_MVP, pos);
		o.uv = TRANSFORM_TEX(uv, _MainTex);
		return o;
	}
	sampler2D _MainTex;
	fixed4 _Color;
	fixed4 frag (v2f i) : SV_Target
	{
		return tex2D(_MainTex, i.uv) * _Color;
	}
	ENDCG
}

Exactly the same result, a lot more boilerplate typing.

Now, we have removed support for actually fixed function GPUs and platforms (in practice: OpenGL ES 1.1 on mobile and Direct3D 7 GPUs on Windows) in Unity 4.3 (that was in late 2013). So there’s no big technical reason to keep on writing shaders in this “fixed function style”… except that 1) a lot of existing projects and packages already have them and 2) for simple things it’s less typing.

That said, fixed function shaders in Unity have downsides too:

  • They do not work on consoles (like PS4, XboxOne, Vita etc.), primarily because generating shaders at runtime is very hard on these platforms.
  • They do not work with MaterialPropertyBlocks, and as a byproduct, do not work with Unity’s Sprite Renderer nor materials animated via animation window.
  • By their nature they are suitable for only very simple things. Often you could start with a simple fixed function shader, only to find that you need to add more functionality that can’t be expressed in fixed function vertex lighting / texture combiners.

How are fixed function shaders implemented in Unity? And why?

Majority of platforms we support do not have the concept of “fixed function rendering pipeline” anymore, so these shaders are internally converted into “actual shaders” and these are used for rendering. The only exceptions where fixed function still exists are: legacy desktop OpenGL (GL 1.x-2.x) and Direct3D 9.

Truth to be told, even on Direct3D 9 we’ve been creating actual shaders to emulate fixed function since Unity 2.6;see this old article. So D3D9 was the first platform we got that implemented this“lazily create actual shaders for each fixed function shader variant” thing.

Then more platforms came along; for OpenGL ES 2.0 we implemented a very similar thing as for D3D9, just instead of concatenating bits of D3D9 shader assembly we’d concatenate GLSL snippets. And then even more platforms came (D3D11, Flash, Metal); each of them implemented this “fixed function generation” code. The code is not terribly complicated; the problem was pretty well understood and we had enough graphics tests verify it works.

Each step along the way, somehow no one really questioned why we keep doing all this. Why do all that at runtime, instead of converting fixed-function-style shaders into “actual shaders” offline, at shader import time? (well ok, plenty of people asked that question; the answer has been “yeah that would make sense; just requires someone to do it” for a while…)

A long time ago generating “actual shaders” for for fixed function style ones offline was not very practical, due to sheer number of possible variants that need to be supported. The trickiest ones to support were texture coordinates (routing of UVs into texture stages; optional texture transformation matrices; optional projected texturing; and optionaltexture coordinate generation). But hey, we’ve removed quite some of that in Unity 5.0 anyway. Maybe now it’s easier? Turns out, it is.

Converting fixed function shaders into regular shaders, at import time

So I set out to do just that. Remove all the runtime code related to “fixed function shaders”; instead just turn them into“regular shaders” when importing the shader file in Unity editor. Created an outline of idea & planned work on our wiki, and started coding. I thought the end result would be “I’ll add 1000 lines and remove 4000 lines of existing code”. I was wrong!

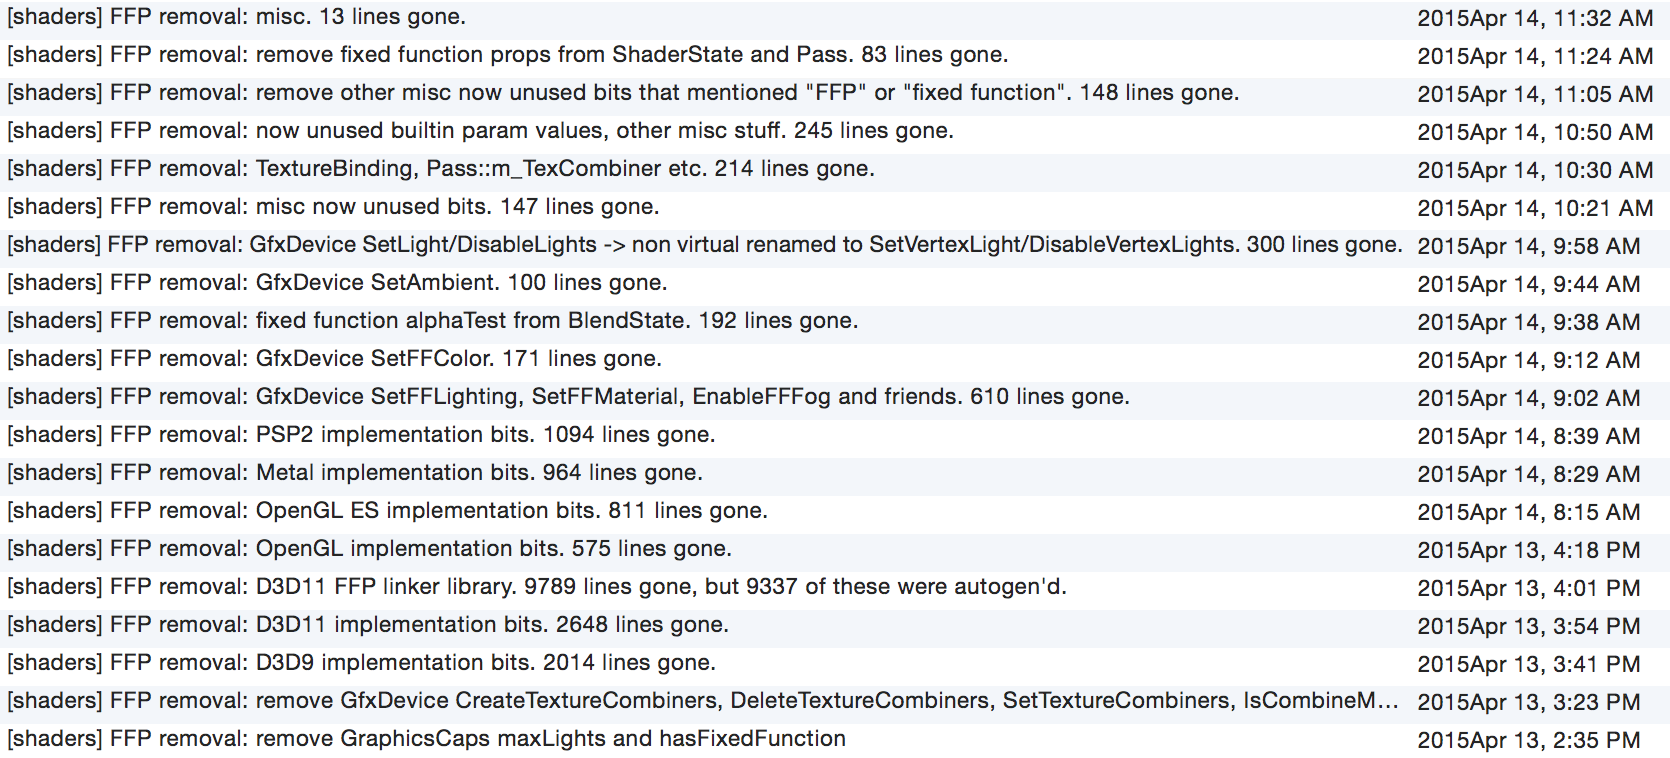
Once I got the basics of shader import side working (turned out, about 1000 lines of code indeed), I started removing all the fixed function bits. That was a day of pure joy:

Almost twelve thousand lines of code, gone. This is amazing!

I never realized all the fixed function code was that large. You write it for one platform, and then it basically works; then some new platform comes and the code is written for that, and then it basically works. By the time you get N platforms, all that code is massive, but it never came in one sudden lump so no one realized it.

Takeaway: once in a while, look at a whole subsystem. You migth be surprised at how much it grew over the years. Maybe some of the conditions for why it is like that do not apply anymore?

Sidenote: per-vertex lighting in a vertex shader

If there was one thing that was easy with fixed function pipeline, is that many features were easily composable. You could enable any number of lights (well, up to 8); and each of them could be a directional, point or a spot light; toggling specular on or off was just a flag away; same with fog etc.

It feels like “easy composition of features” is a big thing we lost when we all moved to shaders. Shaders as we know them (i.e. vertex/fragment/… stages) aren’t composable at all! Want to add some optional feature – that pretty much means either “double the amount of shaders”, or branching in shaders, or generating shaders at runtime. Each of these has their own tradeoffs.

For example, how do you write a vertex shader that can do up to 8 arbitrary lights? There are many ways of doing it; what I have done right now is:

Separate vertex shader variants for “any spot lights present?”, “any point lights present?” and “directional lights only” cases. My guess is that spot lights are very rarely used with per-vertex fixed function lighting; they just look really bad. So in many cases, the cost of “compute spot lights” won’t be paid.

Number of lights is passed into the shader as an integer, and the shader loops over them. Complication: OpenGL ES 2.0 / WebGL, where loops can only have constant number of iterations :( In practice many OpenGL ES 2.0 implementations do not enforce that limitation; however WebGL implementations do. At this very moment I don’t have a good answer; on ES2/WebGL I just always loop over all 8 possible lights (the unused lights have black colors set). For a real solution, instead of a regular loop like this:

uniform int lightCount;
// ...
for (int i = 0; i < lightCount; ++i)
{
	// compute light #i
}

I’d like to emit a shader like this when compiling for ES2.0/WebGL:

uniform int lightCount;
// ...
for (int i = 0; i < 8; ++i)
{
	if (i == lightCount)
		break;
	// compute light #i
}

Which would be valid according to the spec; it’s just annoying to deal with seemingly arbitrary limitations like this (I heard that WebGL 2 does not have this limitation, so that’s good).

What do we have now

So the current situation is that, by removing a lot of code, I achieved the following upsides:

  • “Fixed function style” shaders work on all platforms now (consoles! dx12!).
  • They work more consistenly across platforms (e.g. specular highlights and attenuation were subtly different between PC & mobile before).
  • MaterialPropertyBlocks work with them, which means sprites etc. all work.
  • Fixed function shaders aren’t rasterized at a weird half-pixel offset on Windows Phone anymore.
  • It’s easier to go from fixed functon shader to an actual shader now; I’ve added a button in shader inspector that just shows all the generated code; you can paste that back and start extending it.
  • Code is smaller; that translates to executable size too. For example Windows 64 bit player got smaller by 300 kilobytes.
  • Rendering is slightly faster (even when fixed function shaders aren’t used)!

That last point was not the primary objective, but is a nice bonus. No particular big place was affected, but quite a few branches and data members were removed from platform graphics abstraction (that only were there to support fixed function runtime). Depending on the projects I’ve tried, I’ve seen up to 5% CPU time saved on the rendering thread (e.g. 10.2ms -> 9.6ms), which is pretty good.

Are there any downsides? Well, yes, a couple:

  • You can not create fixed function shaders at runtime anymore. Before, you could do something like avar mat = new Material("<fixed function shader string>") and it would all work. Well, except for consoles, where these shaders were never working. For this reason I’ve made the Material(string) constructor be obsolete with a warning for Unity 5.1; but it will actually stop working later on.
  • It’s a web player backwards compatibility breaking change, i.e. if/once this code lands to production (for example, Unity 5.2) that would mean 5.2 runtime can not playback Unity 5.0/5.1 data files anymore. Not a big deal, we just have to decide if with (for example) 5.2 we’ll switch to a different web playerrelease channel.
  • Several corner cases might not work. For example, a fixed function shader that uses a globally-set texture that isnot a 2D texture. Nothing about that texture is specified in the shader source itself; so while I’m generating actual shader at import time I don’t know if it’s a 2D or a Cubemap texture. So for global textures I just assume they are going to be 2D ones.
  • Probably that’s it!

Removing all that fixed function runtime support also revealed more potential optimizations. Internally we were passing things like “texture type” (2D, Cubemap etc.) for all texture changes – but it seems that it was only the fixed function pipeline that was using it. Likewise, we are passing a vertex-declaration-like structure for each and every draw call; but now I think that’s not really needed anymore. Gotta look further into it.

Until next time!


Careful With That STL map insert, Eugene

$
0
0

So we had this pattern in some of our code. Some sort of “device/API specific objects” need to be created out of simple “descriptor/key” structures. Think D3D11 rasterizer state orMetal pipeline state, or something similar to them.

Most of that code looked something like this (names changed and simplified):

// m_States is std::map<StateDesc, DeviceState>

const DeviceState* GfxDevice::CreateState(const StateDesc& key)
{
	// insert default state (will do nothing if key already there)
	std::pair<CachedStates::iterator, bool> res = m_States.insert(std::make_pair(key, DeviceState()));
	if (res.second)
	{
		// state was not there yet, so actually create it
		DeviceState& state = res.first->second;
		// fill/create state out of key
	}
	// return already existing or just created state
	return &res.first->second;
}

Now, past the initial initialization/loading, absolute majority of CreateState calls will just return already created states.

StateDesc and DeviceState are simple structs with just plain old data in them; they can be created on the stack and copied around fairly well.

What’s the performance of the code above?

It is O(logN) complexity based on how many states are created in total, that’s a given (std::map is a tree, usually implemented as a red-black tree; lookups are logarithmic complexity). Let’s say that’s not a problem, we can live with logN complexity there.

Yes, STL maps are not quite friendly for the CPU cache, since all the nodes of a tree are separately allocated objects, which could be all over the place in memory. Typical C++ answer is “use a special allocator”. Let’s say we have that too; all these maps use a nice “STL map” allocator that’s designed for fixed allocation size of a node and they are all mostly friendly packed in memory. Yes the nodes have pointers which take up space etc., but let’s say that’s ok in our case too.

In the common case of “state is already created, we just return it from the map”, besides the find cost, are there any other concerns?

Turns out… this code allocates memory. Always (*). And in the major case of state already being in the map, frees the just-allocated memory too, right there.

“bbbut… why?! how?”

(*) not necessarily always, but at least in some popular STL implementations it does.

Turns out, quite some STL implementations have map.insert written in this way:

node = allocateAndInitializeNode(key, value);
insertNodeIfNoKeyInMap(node);
if (didNotInsert)
	destroyAndFreeNode(node);

So in terms of memory allocations, calling map.insert with a key that already exists is more costly (incurs allocation+free). Why?! I have no idea.

I’ve tested with several things I had around.

STLs that always allocate:

Visual C++ 2015 Update 1:

_Nodeptr _Newnode = this->_Buynode(_STD forward<_Valty>(_Val));
return (_Insert_nohint(false, this->_Myval(_Newnode), _Newnode));

(_Buynode allocates, _Insert_nohint at end frees if not inserted).

Same behaviour in Visual C++ 2010.

Xcode 7.0.1 default libc++:

__node_holder __h = __construct_node(_VSTD::forward<_Vp>(__v));
pair<iterator, bool> __r = __node_insert_unique(__h.get());
if (__r.second)
    __h.release();
return __r;

STLs that only allocate when need to insert:

These implementations first do a key lookup and return if found, and only if not found yet then allocate the tree node and insert it.

Xcode 7.0.1 with (legacy?) libstdc++.

EA’s EASTL. See red_black_tree.h.

@msinilo’s RDESTL. See rb_tree.h.

Conclusion?

STL is hard. Hidden differences between platforms like that can bite you. Or as @maverikou said, “LOL. this calls for a new emoji”.

In this particular case, a helper function that manually does a search, and only insert if needed would help things. Using a lower_bound + insert with iterator “trick” to avoid second O(logN) search on insert might be useful. See this answer on stack overflow.

Curiously enough, on that (and other similar) SO threads other answers are along the lines of “for simple key/value types, just calling insert will be as efficient”. Ha. Haha.

10 Years at Unity

$
0
0

Turns out, I started working on this “Unity” thing exactly 10 years ago. I wrote the backstory in“2 years later” and “4 years later“ posts, so not worth repeating it here.

A lot of things have happened over these 10 years, some of which are quite an experience.

Seeing the company go through various stages, from just 4 of us back then to, I dunno, 750 amazing people by now? is super interesting. You get to experience the joys & pains of growth, the challenges and opportunities allowed by that and so on.

Seeing all the amazing games made with Unity is extremely motivating. Being a part this super-popular engine that everyone loves to hate is somewhat less motivating, but hey let’s not focus on that today :)

Having my tiny contributions in all releases from Unity 1.2.2 to (at the time of writing) 5.3.1 and 5.4 beta feels good too!

What now? or “hey, what happened to Optimizing Unity Renderer posts?”

Last year I did several “Optimizing Unity Renderer” posts (part 1,part 2,part 3) and then, when things were about to get interesting, I stopped. Wat happend?

Well, I stopped working on them optimizations; the multi-threaded rendering and other optimizations are done by people who are way better at it than I am (@maverikou,@n3rvus, @joeldevahl and some others who aren’t on twitterverse).

So what I am doing then?

Since mid-2015 I’ve moved into kinda-maybe-a-lead-but-not-quite position. Perhaps that’s better characterized as“all seeing evil eye” or maybe “that guy who asks why A is done but B is not”. I was the “graphics lead” a number of years ago, until I decided that I should just be coding instead. Well, now I’m back to “you don’t just code” state.

In practice I do several things for past 6 months:

  • Reviewing a lot of code, or the “all seeing eye” bit. I’ve already been doingquite a lot of that, but with large amount of new graphics hires in 2015 the amount of graphics-related code changes has gone up massively.
  • Part of a small team that does overall “graphics vision”, prioretization, planning, roadmapping and stuff. The “why A is done when B should be done instead” bit. This also means doing job interviews, looking into which areas are understaffed, onboarding new hires etc.
  • Bugfixing, bugfixing and more bugfixing. It’s not a secret that stability of Unity could be improved. Or that“Unity does not do what I think it should do” (which very often is not technically“bugs”, but it feels like that from the user’s POV) happens a lot.
  • Improving workflow for other graphics developers internally. For example trying to reduce the overhead of ourgraphics tests and so on.
  • Work on some stuff or write some documentation when time is left from the above. Not much of actual coding done so far, largest items I remember are some work on frame debugger improvements (in 5.3), texture arrays / CopyTexture (in 5.4 beta) and a bunch of smaller items.

For the foreseeable future I think I’ll continue doing the above.

By now we do have quite a lot of people to work on graphics improvements; my own personal goal is that by mid-2016 there will be way less internet complaints along the lines of “unity is shit”. So, less regressions, less bugs, more stability, more in-depth documentation etc.

Wish me luck!

Backporting Fixes and Shuffling Branches

$
0
0

“Everyday I’m Shufflin’” – LMFAO

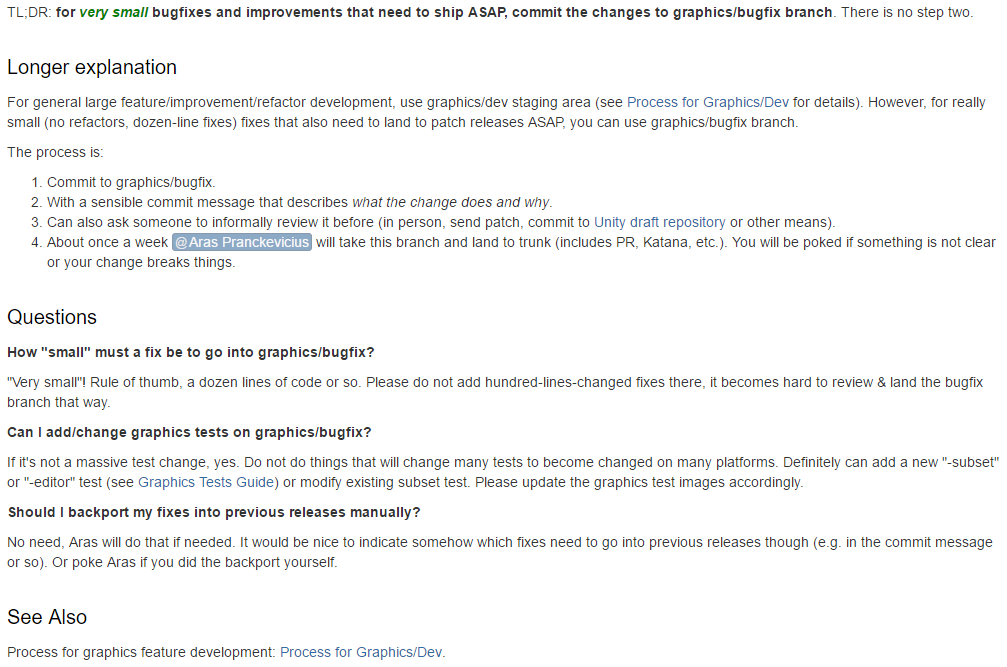
For past few months at work I’m operating this “graphics bugfixes” service. It’s a very simple, free (*) service that I’m doing to reduce overhead of doing “I have this tiny little fix there” changes. Aras-as-a-service, if you will. It works like explained in the image on the right.

(*) Where’s the catch? It’s free, so I’ll get a million people to use it, and then it’s a raging success! My plan is perfect.

Backporting vs Forwardporting Fixes

We pretty much always work on three releases at once: the “next” one (“trunk”, terminology back from Subversion source control days), the “current” one and the “previous” one. Right now these are:

  • trunk: will become Unity 5.5 sometime later this year (see roadmap).
  • 5.4: at the moment in fairly late beta, stabilization/polish.
  • 5.3.x: initially released end of 2015, currently “long term support” release that will get fixes for many months.

Often fixes need to go into all three releases, sometimes with small adjustments. About the only workflow that has worked reliably here is: “make the fix in the latest release, backport to earlier as needed”. In this case, make the fix on trunk-based code, backport to 5.4 if needed, and to 5.3 if needed.

The alternative could be making the fix on 5.3, and forward porting to 5.4 & trunk. This we do sometimes, particularly for “zomg everything’s on fire, gotta fix asap!” type of fixes. The risk with this, is that it’s easy to “lose” a fix in the future releases. Even with best intentions, some fixes will be forgotten to be forward-ported, and then it’s embarrassing for everyone.

Shufflin’ 3 branches in your head can get confusing, doubly so if you’re also trying to get something else done. Here’s what I do.

1: Write Down Everything

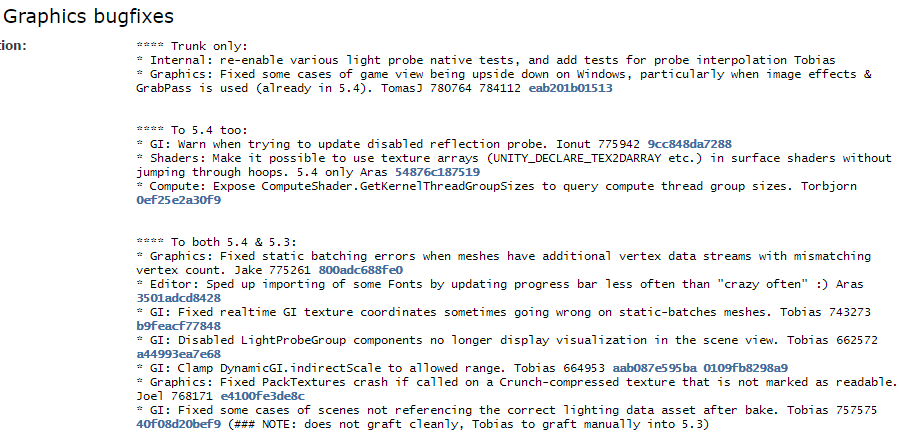
When making a rollup pull request of fixes to trunk, write down everything in the PR description.

  • List of all fixes, with human-speak sentence of each (i.e. what would go into release notes). Sometimes a summary of commit message already has that, sometimes it does not. In the latter case, look at the fix and describe in simple words what it does (preferably from user’s POV).
  • Separate the fixes that don’t need backporting, from the ones that need to go into 5.4 too, and the ones that need to go into both 5.4 and 5.3.
  • Write down who made the fix, which bug case numbers it solves, and which code commits contain the fix (sometimes more than one!). The commits are useful later when doing actual backports; easier than trying to fish them out of the whole branch.

Here’s a fairly small bugfix pull request iteration with all the above:

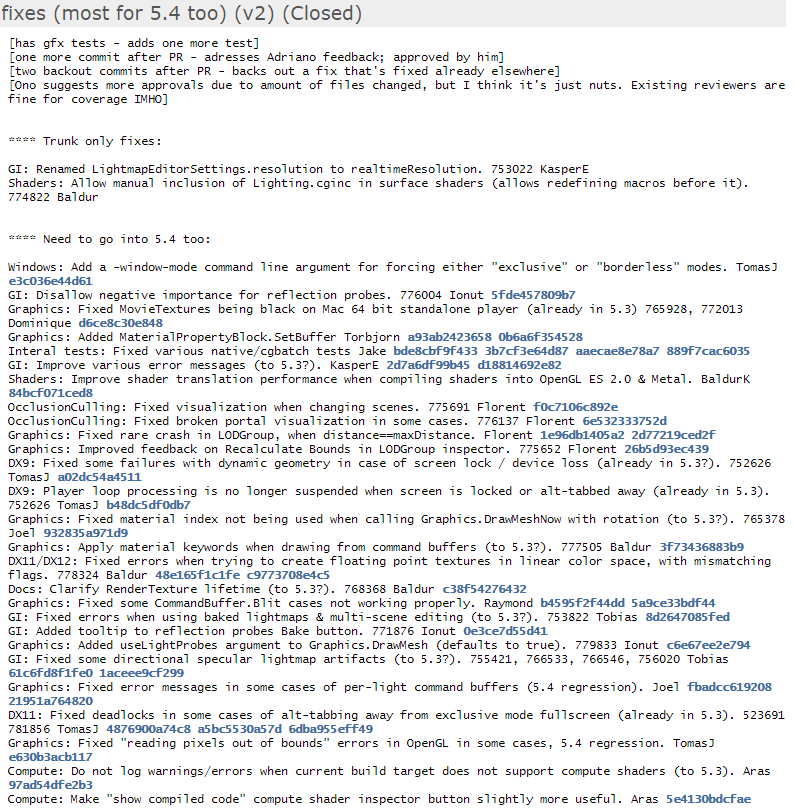
Nice and clean! However, some bugfix batches do end up quite messy; here’s the one that was quite involved. Too many fixes, too large fixes, too many code changes, hard to review etc.:

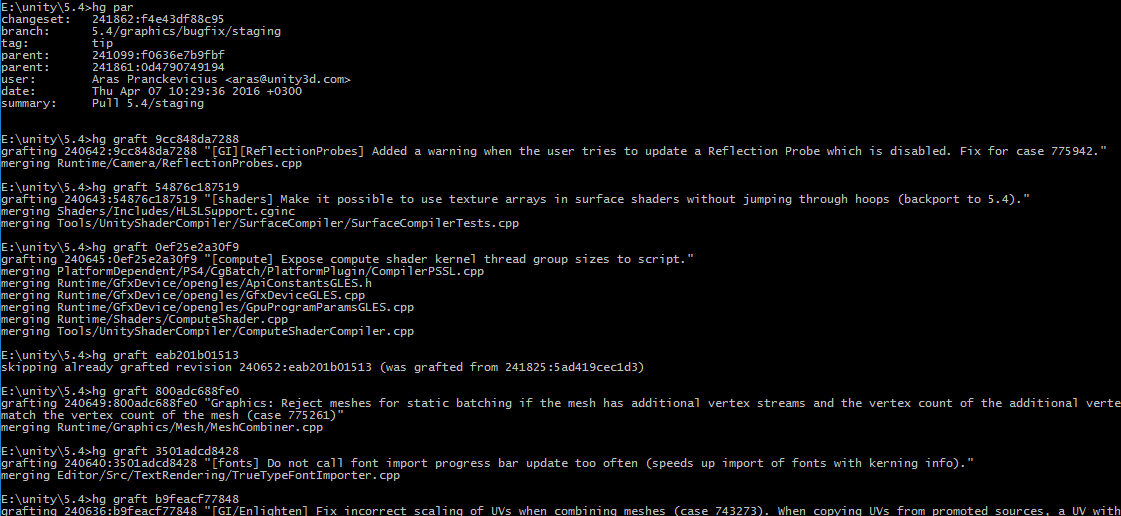
2: Do Actual Backporting

We’re using Mercurial, so this is mostly grafting commits between branches. This is where having commit hashes written down right next to fixes is useful.

Several situations can result when grafting things back:

  • All fine! No conflicts no nothing. Good, move on.
  • Turns out, someone already backported this (communication, it’s hard!). Good, move on.
  • Easy conflicts. Look at the code, fix if trivial enough and you understand it.
  • Complex conflicts. Talk with author of original fix; it’s their job to either backport manually now, or advise you how to fix the conflict.

As for actual repository organization, I have three clones of the codebase on my machine: trunk, 5.4, 5.3. Was using a single repository and switching branches before, but it takes too long to do all the preparation and building, particularly when switching between branches that are too far away from each other. Our repository size is fairly big, so hg share extension is useful - make trunk the “master” repository, and the other ones just working copies that share the same innards of a .hg folder. SSDs appreciate 20GB savings!

3: Review After Backporting

After all the grafting, create pull requests for 5.4 and 5.3, scan through the changes to make sure everything got through fine. Paste relevant bits into PR description for other reviewers:

And then you’re left with 3 or so pull requests, each against a corresponding release. In our case, this means potentially adding more reviewers for sanity checking, running builds and tests on the build farm, and finally merging them into actual release once everything is done. Dance time!

This is all.

Solving DX9 Half-Pixel Offset

$
0
0

Summary: the Direct3D 9 “half pixel offset” problem that manages to annoy everyone can be solved in a single isolated place, robustly, and in a way where you don’t have to think about it ever again. Just add two instructions to all your vertex shaders, automatically.

…here I am wondering if the target audience for D3D9 related blog post in 2016 is more than 7 people in the world. Eh, whatever!

Background

Direct3D before version 10 had this pecularity called “half pixel offset”, where viewport coordinates are shifted by half a pixel compared to everyone else (OpenGL, D3D10+, Metal etc.). This causes various problems, particularly with image post-processing or UI rendering, but elsewhere too.

The official documentation (”Directly Mapping Texels to Pixels”), while being technically correct, is not exactly summarized into three easy bullet points.

The typical advice is various: “shift your quad vertex positions by half a pixel” or “shift texture coordinates by half a texel”, etc. Most of them talk almost exclusively about screenspace rendering for image processing or UI.

The problem with all that, is that this requires you to remember to do things in various little places. Your postprocessing code needs to be aware. Your UI needs to be aware. Your baking code needs to be aware. Some of your shaders need to be aware. When 20 places in your code need to remember to deal with this, you know you have a problem.

3D has half-pixel problem too!

While most of material on D3D9 half pixel offset talks about screen-space operations, the problem exists in 3D too! 3D objects are rendered slightly shifted compared to what happens on OpenGL, D3D10+ or Metal.

Here’s a crop of a scene, rendered in D3D9 vs D3D11:

And a crop of a crop, scaled up even more, D3D9 vs D3D11:

Root Cause and Solution

The root cause is that viewport is shifted by half a pixel compared to where we want it to be. Unfortunately we can’t fix it by changing all coordinates passed into SetViewport, shifting them by half a pixel (D3DVIEWPORT9 coordinate members are integers).

However, we have vertex shaders. And the vertex shaders output clip space position. We can adjust the clip space position, to shift everything by half a viewport pixel. Essentially we need to do this:

// clipPos is float4 that contains position output from vertex shader
// (POSITION/SV_Position semantic):
clipPos.xy += renderTargetInvSize.xy * clipPos.w;

That’s it. Nothing more to do. Do this in all your vertex shaders, setup shader constant that contains viewport size, and you are done.

I must stress that this is done across the board. Not only postprocessing or UI shaders. Everything. This fixes the 3D rasterizing mismatch, fixes postprocessing, fixes UI, etc.

Wait, why no one does this then?

Ha. Turns out, they do!

Maybe it’s common knowledge, and only I managed to be confused? Sorry about that then! Should have realized this years ago…

Solving This Automatically

The “add this line of HLSL code to all your shaders” is nice if you are writing or generating all the shader source yourself. But what if you don’t? (e.g. Unity falls into this camp; zillions of shaders already written out there)

Turns out, it’s not that hard to do this at D3D9 bytecode level. No HLSL shader code modifications needed. Right after you compile the HLSL code into D3D9 bytecode (via D3DCompile or fxc), just slightly modify it.

D3D9 bytecode is documented in MSDN, “Direct3D Shader Codes”.

I thought whether I should be doing something flexible/universal (parse “instructions” from bytecode, work on them, encode back into bytecode), or just write up minimal amount of code needed for this patching. Decided on the latter; with any luck D3D9 is nearing it’s end-of-life. It’s very unlikely that I will ever need more D3D9 bytecode manipulation. If in 5 years from now we’ll still need this code, I will be very sad!

The basic idea is:

  1. Find which register is “output position” (clearly defined in shader model 2.0; can be arbitrary register in shader model 3.0), let’s call this oPos.
  2. Find unused temporary register, let’s call this tmpPos.
  3. Replace all usages of oPos with tmpPos.
  4. Add mad oPos.xy, tmpPos.w, constFixup, tmpPos and mov oPos.zw, tmpPos at the end.

Here’s what it does to simple vertex shader:

vs_3_0           // unused temp register: r1
dcl_position v0
dcl_texcoord v1
dcl_texcoord o0.xy
dcl_texcoord1 o1.xyz
dcl_color o2
dcl_position o3  // o3 is position
pow r0.x, v1.x, v1.y
mul r0.xy, r0.x, v1
add o0.xy, r0.y, r0.x
add o1.xyz, c4, -v0
mul o2, c4, v0
dp4 o3.x, v0, c0 // -> dp4 r1.x, v0, c0
dp4 o3.y, v0, c1 // -> dp4 r1.y, v0, c1
dp4 o3.z, v0, c2 // -> dp4 r1.z, v0, c2
dp4 o3.w, v0, c3 // -> dp4 r1.w, v0, c3
                 // new: mad o3.xy, r1.w, c255, r1
                 // new: mov o3.zw, r1

Here’s the code in a gist.

At runtime, each time viewport is changed, set vertex shader constant (I picked c255) to contain(-1.0f/width, 1.0f/height, 0, 0).

That’s it!

Any downsides?

Not much :) The whole fixup needs shaders that:

  • Have an unused constant register. Majority of our shaders are shader model 3.0, and I haven’t seenvertex shaders that use all 32 temporary registers. If that is a problem, “find unused register” analysis could be made smarter, by looking for an unused register just in the place between earliest and latest position writes. I haven’t done that.
  • Have an unused constant register at some (easier if fixed) index. Base spec for both shader model 2.0 and 3.0 is that vertex shaders have 256 constant registers, so I just picked the last one (c255) to contain fixup data.
  • Have instruction slot space to put two more instructions. Again, shader model 3.0 has 512 instruction slot limit and it’s very unlikely it’s using more than 510.

Upsides!

Major ones:

  • No one ever needs to think about D3D9 half-pixel offset, ever, again.
  • 3D rasterization positions match exactly between D3D9 and everything else (D3D11, GL, Metal etc.).

Fixed up D3D9 vs D3D11. Matches now:

I ran all the graphics tests we have, inspected all the resulting differences, and compared the results with D3D11. Turns out, this revealed a few minor places where we got the half-pixel offset wrong in our shaders/code before. So additional advantages (all Unity specific):

  • Some cases of GrabPass were sampling in the middle of pixels, i.e. slightly blurred results. Matches DX11 now.
  • Some shadow acne artifacts slightly reduced; matches DX11 now.
  • Some cases of image postprocessing effects having a one pixel gap on objects that should have been touching edge of screen exactly, have been fixed. Matches DX11 now.

All this will probably go into Unity 5.5. Still haven’t decided whether it’s too invasive/risky change to put into 5.4 at this stage.

Maldives Vacation Report 2016

$
0
0

Just spent 9 days in Maldives doing nothing! So here’s a writeup and a bunch of photos.

“Magical”, “paradise”, “heaven” and other things, they say. So we decided to check it out for ourselves. Another factor was that after driving-heavy vacations in some previous years (e.g. USA or Iceland), the kids wanted to just do nothing for a bit. Sit in the water & snorkel, basically.

So off we went, all four of us. Notes in random order:

Picking where to go

This one’s tough. We don’t like resorts and hotels, so at first thought about going airbnb-style. Turns out, there isn’t much of that going on in Maldives; and some of the places that have airbnb listings up are actually just ye olde hotels or guesthouses anyway.

Lazy vacation being lazy, then it was “pick an island & resort” time. This primarily depends on your budget; from guesthouses at the low end to… well I guess there’s no limit how expensive it can go. “Very” would be an accurate description.

There are other factors, like whether you want to dive or snorkel (then look for diving spots & reef information), how much entertainment options you want, whether you’re bringing kids etc. etc.

What kinda sucks about many of the blogs on Maldives, is that they are written as if an honest impression from some traveller, only to find in a small print that hey, the resort or some travel agency covered their expenses. Apparently this “travel blogger” is an actual profession that people make money on; a subtle form of advertisement. Good for them, but makes you wonder how biased their blog posts are.

We wanted a smallish resort, that’s kinda “midrange” in terms of prices, has good reviews and has a decent house reef. Upon some searching, picked Gangehi (tripadvisor link) kinda randomly. Here are basic impressions:

  • Good: nice, small, clean, good reef, nice beach area for small kids.
  • Neutral: food was a mixed bag (some very good, some meh).

Going there

It feels like “hey it’s somewhat beyond Turkey, not that far away”, but it’s more like “Sri Lanka distance away”. For us that was a drive to Vilnius, 2.5hr flight to Istanbul, and 8hr flight to Male, and from there a ~30 minute seaplane flight to the resort.

Seeing the atols during the plane landing is very impressive, especially if you haven’t seen such a thing before (none of us had). They do not look like a real thing :)

Maldives is a whole bunch of separate tiny islands, so the only choice of travel is either by boat or seaplane. None of us flew that before either, so that was interesting too! Here it is, and here’s the resort’s “airport”. After this, even the airports we have here in Lithuania are ginormous by comparison:

Maldives with kids?!

This is supposedly a honeymoon destination, or something. Instead, we went about 14 years too late for that, and with two kids. Punks not dead! It’s fine; at least in our resort there weren’t that many honeymoon couples, actually. There was no special enternainment for kids, but hey, water that you can spend full day in, snorkeling and sand. And an iPad for when that gets boring (whole-family-fun this time wasSmallworld 2).

There are some resorts that have special “kid activities” (not sure if we would have cared for that though), and I’m told there are others that explicitly do not allow kids. But overall, if your kids like water you should be good to go.

Maldives in July?!

July is very much a non-season in Maldives – it’s the rain season, and the temperature is colder by a whopping 2 degrees! This leaves it at 31C in the day, and 28C in the night. The horror! :)

The upside of going there now: fewer people around, and apparently prices somewhat lower. We lucked out in that almost all the rain was during the nights; over whole week got maybe 15 minutes of rain in the daytime.

Snorkeling

Now, none of us are divers. We have never snorkeled before either. Most of us (except Marta) can barely swim as well – e.g. my swimming skills are “I’m able to not drown” :) So this time we decided “ok let’s try snorkeling”, and diving (including learning how to do that) will be left for another time.

It’s pretty cool.

Apparently the current El Niño has contributed quite a lot tocoral bleaching in Maldives; the same reef was quite a lot more colorful half a year ago.

We’re the ones that don’t have any sort of GoPro, and considered getting one before the trip for taking pictures. However, we don’t care about video at all, so went for Olympus TG-4 instead. RAW support and all that. The underwater and water splashing photos are from that camera.

The other photos on this post are either Canon EOS 70D with Canon 24-70mm f/2.8 L II lens or an iPhone 6.

What else is there to do?

Not much, actually :) Splash in the water and walk around:

Watch an occasional bird, stingray (here, cowtail stingray, pastinachus sephen) or shark (no photos of sharks, but there’s a ton of little sharks all around; they are not dangerous at all):

Build castles made of sand, that melt into the sea eventually. Watch hermit crabs drag their shells around.

Take pictures in the traditional “photo to post on facebook” style. Apparently this makes you look awesome, or something.

That thing with houses on top of water is a cute hack by the resorts. The amount of land available is extremely limited, so hey, let’s build houses on water and tell people they are awesome! :)

Take nighttime photos. This is almost equator, so the sun sets very early; by 7:30PM it’s already dark.

Just walk around, if you can call it that. This island was maybe 150 meters in diameter, so “the walks” are minutes in length.

Go on a boat trip to (try to) see dolphins. We actually saw them:

Another boat trip to see a local non-resort island (Mathiveri):

Oh, and the sunsets. Gotta take pictures of the sunsets:

And that’s about it. The rest of the time: reading, sleeping, doing nothing :)

Conclusion?

What would I do differently next time?

Spending 8-9 days in a single place is stretching it. The amount of photos above make it sound like there’s a lot of things to do, but you can do all that in two days. If you’re really prepared for a “do nothing” style vacation, then it’s fine. I’m not used to that (though a friend told me: “Aras, you just need to practice more! No one gets it from the 1st time!”). So I’d probably either do the whole thing shorter, or split it up in two different islands, plus perhaps a two-day guesthouse stay at a local (non-resort) island for a change. Apparently that even has a term, “island hopping”.

Would there be next time?

Not sure yet. It was very nice to see, once. Maybe some other time too – but very likely for next vacation or two we’ll go back to“travel & drive around & see things” style. But if we want another lazy vacation, then it’s a really good place… if your budget allows. This trip was slightly more expensive than our US roadtrip, for example.

So that’s it, until next time!

Adam Demo production talk at CGEvent

$
0
0

A while ago I delivered a talk at CG EVENT 2016 in Vilnius, about some production details of Unity’s Adam demo.

Clarification point! I did nothing at all for the demo production, just did the talk pretending to be @__ReJ__. Also, there are more blog posts about the demo production on Unity blog, e.g.Adam - Production Design for Realtime Short Film by @_calader. All credit goes to the demo team, I only delivered the message :)

Here are the talk slides (34MB pdf).

Some of them were meant to be videos, so here they are, individually:

Slide 41, rough animatic:

Slide 46, previz:

Slide 47, previz with lighting & camera:

Slide 48, early Neuron mocap:

Slide 49, previz with shading & mocap:

Slide 50, previz with postprocessing:

Slide 52, Vicon mocap:

Slide 59, WIP animations & fracture:

Slide 60, eye animation:

Slide 68, area lights:

Slide 71, translucency shader:

Slide 73, crowd simulation:

Hash Functions all the way down

$
0
0

A while ago I needed fast hash function for ~32 byte keys. We already had MurmurHash used in a bunch of places, so I started with that. But then I tried xxHash and that was a bit faster! So I dropped xxHash into the codebase, landed the thing to mainline and promptly left forvacation, with a mental note of “someday should look into other hash functions, or at least move them all under a single folder”.

So that’s what I did: “hey I’ll move source code of MurmurHash, SpookyHash and xxHash under a single place”. But that quickly spiraled out of control:

The things I found! Here’s what you find in a decent-sized codebase, with many people working on it:

  • Most places use a decent hash function – in our case Murmur2A for 32/64 bit hashes, and SpookyV2 for 128 bit hashes. That’s not a bad place to be in!
  • Murmur hash takes seed as input, and naturally almost all places in code copy-pasted the same random hex value as the seed :)
  • There are at least several copies of either FNV or djb2 hash function implementations scattered around, used in random places.
  • Some code uses really, REALLY bad hash functions. There’s even a comment above it, added a number of years ago, when someone found out it’s bad – however they only stopped using it in their own place, and did not replace other usages.Life always takes the path of least resistance :) Thankfully, the places where said hash function was used were nothing “critical”.
  • While 95% of code that uses non-cryptographic hash functions uses them strictly for runtime reasons (i.e. they don’t actually care about exact value of the hash), there are some pieces that hash something, and serialize the hashed value. Each of these need to be looked at in detail, whether you can easily switch to a new hash function.
  • Some other hash related code (specifically, a struct we have to hold 128 bit hashed value, Hash128), were written in afunky way, ages ago. And of course some of our code got that wrong (thankfully, all either debug code, or test mocking code, or something not-critical). Long story short, do not have struct constructors like this:Hash128(const char* str, int len=16)!
    • Someone will think this accepts a string to hash, not “bytes of the hash value”.
    • Someone will pass "foo" into it, and not provide length argument, leading to out-of-bounds reads.
    • Some code will accidentally pass something like 0 to a function that accepts a Hash128, and because C++ is C++, this will get turned into a Hash128(NULL, 16) constructor, and hilarity will ensue.
    • Lesson: be careful with implicit constructors (use explicit). Be careful with default arguments. Don’t set types to const char* unless it’s really a string.

So what started out as “move some files” branch, ended up being a “move files, switch most of hash functions, remove some bad hash functions, change some code, fix some wrong usages, add tests and comments” type of thing. It’s a rabbit hole of hash functions, all the way down!

Anyway.

Hash Functions. Which one to use?

MurmurHash got quite popular, at least in game developer circles, as a “general hash function”. My quick twitter poll seems to reflect that:

It’s a fine choice, but let’s see later if we can generally do better. Another fine choice, especially if you know more about your data than“it’s gonna be an unknown number of bytes”, is to roll your own (e.g. seeWon Chun’s replies, orRune’s modified xxHash/Murmur that are specialized for 4-byte keys etc.). If you know your data, always try to see whether that knowledge can be used for good effect!

Sometimes you don’t know much about the data, for example if you’re hashing arbitrary files, or some user input that could be“pretty much anything”.

So let’s take a look at general purpose hash functions. There’s plenty of good tests on the internets (e.g.Hash functions: An empirical comparison), but I wanted to make my own little tests. Because why not! Here’s my randomly mashed together little testbed (use revision 4d535b).

Throughput

Here’s results of various hash functions, hashing data of different lengths, with performance in MB/s:

This was tested on late 2013 MacBookPro (Core i7-4850HQ 2.3GHz), Xcode 7.3.1 release 64 bit build.

  • xxHash in 32 and 64 bit variants, as well as “use 64 bit, take lowest 32 bits of result” one.
  • SpookyHash V2, the 128 bit variant, only taking 64 lowest bits.
  • Murmur, a couple variants of it.
  • CRC32, FNV and djb2, as I found them in our own codebase. I did not actually check whether they are proper implementations or somehow tweaked! Their source is at the testbed, revision 4d535b.

In terms of throughput at not-too-small data sizes (larger than 10-20 bytes), xxHash is the king. If you need 128 bit hashes,SpookyHash is very good too.

What about small keys?

Good question! The throughput of XXH64 is achieved by carefully exploitinginstruction level parallelism of modern CPUs. It has a main loop that does 32 bytes at a time, with four independent hashing rounds. It looks something like this:

// rough outline of XXH64:
// ... setup code
do {
    v1 = XXH64_round(v1, XXH_get64bits(p)); p+=8;
    v2 = XXH64_round(v2, XXH_get64bits(p)); p+=8;
    v3 = XXH64_round(v3, XXH_get64bits(p)); p+=8;
    v4 = XXH64_round(v4, XXH_get64bits(p)); p+=8;
} while (p<=limit);
// ... merge v1..v4 values
// ... do leftover bit that is not multiple of 32 bytes

That way even if it looks like it’s “doing more work”, it ends up being faster than super simple algorithms like FNV, that work on one byte at a time, with each and every operation depending on the result of the previous one:

// rough outline of FNV:
while (*c)
{
	hash = (hash ^ *c++) * p;
}

However, xxHash has all this “prologue” and “epilogue” code around the main loop, that handles either non-aligned data, or leftovers from data that aren’t multiple of 32 bytes in size. That adds some branches, and for short keys it does not even go into that smart loop!

That can be seen from the graph above, e.g. xxHash 32 (which has core loop of 16-bytes-at-once) is faster at key sizes < 100 bytes. Let’s zoom in at even smaller data sizes:

Here (data sizes < 10 bytes) we can see that the ILP smartness of other algorithms does not get to show itself, and the super-simplicity of FNV or djb2 win in performance. I’m picking out FNV as the winner here, because in my tests djb2 had somewhat more collisions (see below).

What about other platforms?

PC/Windows: tests I did on Windows (Core i7-5820K 3.3GHz, Win10, Visual Studio 2015 release 64 bit) follow roughly the same pattern as the results on a Mac. Nothing too surprising here.

Consoles: did a quick test on XboxOne. Results are surprising in two ways: 1) oh geez the console CPUs are slow (well ok that’s not too surprising), and 2) xxHash is not that awesome here. It’s still decent, but xxHash64 has consistenly worse performance than xxHash32, and for larger keys SpookyHash beats them all. Maybe I need to tweak some settings or poke Yann to look at it? Adding a mental note to do that later…

Mobile: tested on iPhone 6 in 64 bit build. Results not too surprising, except again, unlike PC/Mac with an Intel CPU, xxHash64 is not massively better than everything else – SpookyHash is really good on ARM64 too.

JavaScript! :) Because it was easy, I also compiled that code into asm.js viaEmscripten. Overall the patterns are similar,except the >32 bit hashes (xxHash64, SpookyV2) – these are much slower. This is expected, both xxHash64 and Spooky are specifically designed either for 64 bit CPUs, or when you absolutely need a >32 bit hash. If you’re on 32 bit, use xxHash32 or Murmur!

What about hash quality?

SMHasher seems to be a de-facto hash function testing suite (see also:a fork that includes more modern hash functions).

For a layman test, I tested several things on data sets I cared about:

  • Words” - just a dump of English words (/usr/share/dict/words). 235886 entries, 2.2MB total size, average length 9.6 bytes.
  • Filenames” - dump of file paths (from a Unity source tree tests folder). 80297 entries, 4.3MB total size, average length 56.4 bytes.
  • “Source” - partial dump of source files from Unity source tree. 6069 entries, 43.7MB total size, average length 7547 bytes.

First let’s see how many collisions we’d get on these data sets, if we used the hash function for uniqueness/checksum type of checking. Lower numbers are better (0 is ideal):

HashWords collisFilenames collisSource collis
xxHash32600
xxHash64-32700
xxHash64000
SpookyV2-64000
Murmur2A1100
Murmur3-32310
CRC32520
FNV510
djb21010
ZOMGBadHash9988420

ZOMGBadHash is that fairly bad hash function I found, as mentioned above. It’s not fast either, and look at that number of collisions! Here’s how it looked like:

unsigned CStringHash(const char* key)
{
	unsigned h = 0;
	const unsigned sr = 8 * sizeof (unsigned) - 8;
	const unsigned mask = 0xFu << (sr + 4);
	while (*key != '\0')
	{
		h = (h << 4) + *key;
		std::size_t g = h & mask;
		h ^= g | (g >> sr);
		key++;
	}
	return h;
}

I guess someone thought a random jumbo of shifts and xors is gonna make a good hash function, or something. And thrown in mixed 32 vs 64 bit calculations too, for good measure. Do not do this! Hash functions are not just random bit operations.

As another measure of “hash quality”, let’s imagine we use the hash functions in a hashtable. A typical hashtable of a load factor 0.8, that always has power-of-two number of buckets (i.e. something like bucketCount = NextPowerOfTwo(dataSetSize / 0.8)). If we’d put the above data sets into this hashtable, then how many entries we’d have per bucket on average? Lower numbers are better (1.0 is ideal):

HashWords avg bucketFilenames avg bucketSource avg bucket
xxHash321.2411.3381.422
xxHash64-321.2401.3351.430
xxHash641.2401.3351.430
SpookyV2-641.2411.3361.434
Murmur2A1.2391.3401.430
Murmur3-321.2421.3401.427
CRC321.2401.3381.421
FNV1.2431.3391.415
djb21.2421.3391.414
ZOMGBadHash1.6332.3637.260

Here all the hash functions are very similar, except the ZOMGBadHash which is, as expected, doing not that well.

TODO

I did not test some of the new-ish hash functions (CityHash, MetroHash, FarmHash). Did not test hash functions that use CPU specific instructions either (for example variants of FarmHash can use CRC32 instruction that’s added in SSE4.2, etc.). That would be for some future time.

Conclusion

  • xxHash64 is really good, especially if you’re on an 64 bit Intel CPU.
  • If you need 128 bit keys, use SpookyHash. It’s also really good if you’re on a non-Intel 64 bit CPU (as shown by XboxOne - AMD and iPhone6 - ARM throughput tests).
  • If you need a 32 bit hash, and are on a 32 bit CPU/system, do not use xxHash64 or SpookyHash! Their 64 bit math is costly when on 32 bit; use xxHash32 or Murmur.
  • For short data/strings, simplicity of FNV or djb2 are hard to beat, they are very performant on short data as well.
  • Do not throw in random bit operations and call that a hash function. Hash function quality is important, and there’s plenty of good (and fast!) hash functions around.

More Hash Function Tests

$
0
0

In the previous post, I wrote about non-crypto hash functions, and did some performance tests. Turns out, it’s great to write about stuff! People at the comments/twitter/internets pointed out more things I should test. So here’s a follow-up post.

What is not the focus

This is about algorithms for “hashing some amount of bytes”, for use either in hashtables or for checksum / uniqueness detection. Depending on your situation, there’s a whole family of algorithms for that, and I am focusing on only one: non-cryptographic fast hash functions.

  • This post is not about cryptographic hashes. Do not read below if you need to hash passwords, sensitive data going through untrusted medium and so on. Use SHA-1, SHA-2, BLAKE2 and friends.
  • Also, I’m not focusing on algorithms that are designed to prevent possible hashtable Denial-of-Service attacks. If something comes from the other side of the internet and ends up inserted into your hashtable, then to prevent possible worst-case O(N) hashtable behavior you’re probably off by using a hash function that does not have known“hash flooding” attacks.SipHash seems to be popular now.
  • If you are hashing very small amounts of data of known size (e.g. single integers or two floats or whatever), you should probably use specialized hashing algorithms for those. Here are someinteger hash functions, or 2Dhashing with Weyl, or perhaps you could take some other algorithm and just specialize it’s code for your known input size (e.g.xxHash for a single integer).
  • I am testing 32 and 64 bit hash functions here. If you need larger hashes, quite likely some of these functions might be suitable (e.g. SpookyV2 always produces 128 bit hash).

When testing hash functions, I have not gone to great lengths to get them compiling properly or setting up all the magic flags on all my platforms. If some hash function works wonderfully when compiled on Linux Itanium box with an Intel compiler, that’s great for you, but if it performs poorly on the compilers I happen to use, I will not sing praises for it. Being in the games industry, I care about things like “what happens in Visual Studio”, and “what happens on iOS”, and “what happens on PS4”.

More hash function tests!

I’ve updated my hash testbed on github (use revision 9b59c91cf) to include more algorithms, changed tests a little, etc etc.

I checked both “hashing data that is aligned” (16-byte aligned address of data to hash), and unaligned data. Everywhere I tested, there wasn’t a notable performance difference that I could find (but then, I have not tested old ARM CPUs or PowerPC based ones). The only visible effect is that MurmurHash and SpookyHash don’t properly work in asm.js / Emscripten compilation targets, due to their usage of unaligned reads. I’d assume they probably don’t work on some ARM/PowerPC platforms too.

Hash functions tested below:

These are the main functions that are interesting. Because people kept on asking, and because “why not”, I’ve included a bunch of others too:

  • SipRef - SipHash-2-4 reference implementation. Like mentioned before, this one is supposedly good for avoiding hash flooding attacks.
  • MD5-32, SHA1-32, CRC32 - simple implementations of well-known hash functions (from SMHasher test suite). Again, these mostly not in the category I’m interested in, but included to illustrate the performance differences.
  • FNV-1a, FNV-1amod - FNV hash andmodified version.
  • djb2, SDBM - both from this site.

Performance Results

Windows / Mac

macOS results, compiled with Xcode 7.3 (clang-based) in Release 64 bit build. Late 2013 MacBookPro:

Windows results, compiled with Visual Studio 2015 in Release 64 bit build. Core i7-5820K:

Notes:

  • Performance profiles of these are very similar.
  • xxHash64 wins at larger (0.5KB+) data sizes, followed closely by 64 bit FarmHash and CityHash.
  • At smaller data sizes (10-500 bytes), FarmHash and CityHash look very good!
  • mum-hash is much slower on Visual Studio. At first I thought it’s _MUM_UNALIGNED_ACCESS macro that was not handling VS-specific defines (_M_AMD64 and _M_IX86) properly (see PR). Turns out it’s not; the speed difference comes from _MUM_USE_INT128 which only kicks in on GCC-based compilers. mum-hash would be pretty competetive otherwise.

Windows 32 bit results, compiled with Visual Studio 2015 in Release 32 bit build. Core i7-5820K:

On a 32 bit platform / compilation target, things change quite a bit!

  • All 64 bit hash functions are slow. For example, xxHash64 frops from 13GB/s to 1GB/s.Use a 32 bit hash function when on a 32 bit target!
  • xxHash32 wins by a good amount.

Note on FarmHash– whole idea behind it is that it uses CPU-specific optimizations (that also change the computed hash value). The graphs above are using default compilation settings on both macOS and Windows. However, on macOS enabling SSE4.2 instructions in Xcode settings makes it much faster at larger data sizes:

With SSE4.2 enabled, FarmHash64 handily wins against xxHash64 (17.9GB/s vs 12.8GB/s) for data that is larger than 1KB. However, that requires compiling with SSE4.2, at my work I can’t afford that. Enabling the same options on XboxOne makes it slower :( Enabling just FARMHASH_ASSUME_AESNI makes the 32 bit FarmHash faster on XboxOne, but does not affect performance of the 64 bit hash. FarmHash also does not have any specific optimizations for ARM CPUs, so my verdict with it all is “not worth bothering” – afterall the impressive SSE4.2 speedup is only for large data sizes.

Mobile

iPhone SE (A9 CPU) results, compiled with Xcode 7.3 (clang-based) in Release 64 bit build:

  • xxHash never wins here; CityHash and FarmHash are fastest across the whole range.

iPhone SE 32 bit results:

This is similar to Windows 32 bit: 64 bit hash functions are slow, xxHash32 wins by a good amount.

Console

Xbox One (AMD Jaguar 1.75GHz CPU) results, compiled Visual Studio 2015 in Release mode:

  • Similar to iPhone results, xxHash is quite a bit slower than CityHash and FarmHash. xxHash uses 64 bit multiplications heavily, whereas others mostly do shifts and logic ops.
  • SpookyHash wins at larger data sizes.

JavaScript

JavaScript (asm.js viaEmscripten) results, running on late 2013 MacBookPro.

  • asm.js is in all practical sense a 32 bit compilation target; 64 bit integer operations are slow.
  • xxHash32 wins, followed by FarmHash32.
  • At smaller (<25 bytes) data sizes, simple hashes like FNV-1a, SDBM or djb2 are useful.

Throughput tables

Performance at large data sizes (~4KB), in GB/s:

Hash64 bit32 bit
WinMaciPhoneSEXboxOneWiniPhoneSEasm.js Firefoxasm.js Chrome
xxHash6413.212.85.71.51.11.50.30.1
City6412.212.27.23.61.61.90.40.1
Mum 4.0 9.54.50.50.71.30.10.1
Farm6412.311.98.23.32.42.20.40.1
SpookyV2-6412.812.57.14.32.61.9 -- --
xxHash32 6.8 6.64.01.56.73.72.51.4
Murmur3-X64-64 7.1 5.82.31.20.90.8 -- --
Murmur2A 3.4 3.31.70.93.41.8 -- --
Murmur3-32 3.1 2.71.30.53.11.3 -- --
City32 5.1 4.92.60.94.02.61.10.8
Farm32 5.2 4.32.61.84.31.92.11.4
SipRef 1.4 1.61.00.40.30.40.10.0
CRC32 0.5 0.50.20.20.40.20.40.4
MD5-32 0.5 0.30.20.20.40.30.40.4
SHA1-32 0.5 0.50.30.10.40.20.30.2
FNV-1a 0.9 0.80.40.30.90.40.80.8
FNV-1amod 0.9 0.80.40.30.90.40.80.7
djb2 0.9 0.80.60.41.10.60.80.8
SDBM 0.9 0.80.40.30.80.40.80.8

Performance at medium size (128 byte) data, in GB/s:

Hash64 bit32 bit
WinMaciPhoneSEXboxOneWiniPhoneSEasm.js Firefoxasm.js Chrome
xxHash646.66.22.80.90.70.70.20.1
City647.67.64.41.71.11.50.30.1
Mum3.27.64.10.50.61.10.10.0
Farm646.65.73.41.40.91.10.30.1
SpookyV2-643.43.21.71.40.70.5 -- --
xxHash325.15.33.41.35.12.82.21.4
Murmur3-X64-645.34.32.11.00.80.7 -- --
Murmur2A3.63.02.10.83.31.7 -- --
Murmur3-323.12.31.30.42.81.3 -- --
City324.03.62.00.73.31.91.00.8
Farm323.93.21.91.03.41.61.61.1
SipRef1.21.30.80.40.30.30.10.0
CRC320.50.50.20.20.40.20.40.4
MD5-320.30.20.20.10.30.20.20.2
SHA1-320.20.20.10.10.10.10.10.1
FNV-1a0.91.00.50.30.90.50.90.9
FNV-1amod0.90.90.50.30.90.50.90.8
djb21.00.90.70.41.10.70.90.8
SDBM0.90.90.50.30.90.50.90.8

Performance at small size (17 byte) data, in GB/s:

Hash64 bit32 bit
WinMaciPhoneSEXboxOneWiniPhoneSEasm.js Firefoxasm.js Chrome
xxHash642.11.80.50.50.40.40.10.0
City643.43.01.50.70.50.70.20.0
Mum1.22.60.90.20.30.50.10.0
Farm643.62.61.20.70.60.60.10.0
SpookyV2-641.21.00.60.40.20.1 -- --
xxHash322.22.00.70.51.90.81.20.8
Murmur3-X64-641.71.30.50.40.30.3 -- --
Murmur2A2.41.81.10.52.11.0 -- --
Murmur3-322.11.50.80.41.80.8 -- --
City322.11.90.90.51.70.70.80.7
Farm322.52.00.80.51.80.90.90.5
SipRef0.60.60.30.20.20.10.00.0
CRC320.80.70.40.20.60.30.50.4
MD5-320.10.10.00.00.10.00.10.0
SHA1-320.00.00.00.00.00.00.00.0
FNV-1a1.31.51.00.31.20.71.41.0
FNV-1amod1.11.40.90.31.00.71.30.9
djb21.61.61.10.41.10.71.30.9
SDBM1.41.31.10.41.20.71.51.0

A note on hash quality

As far as I’m concerned, all the 64 bit hashes are excellent quality.

Most of the 32 bit hashes are pretty good too on the data sets I tested.

SDBM produces more collisions than others on binary-like data (various struct memory dumps, 5742 entries, average length 55 bytes – SDBM had 64 collisions, all the other hashes had zero). You could have a way worse hash function than SDBM of course, but then functions like FNV-1a are about as simple to implement, and seem to behave better on binary data.

A note on hash consistency

Some of the hash functions do not produce identical output on various platforms. Among the ones I tested, mum-hash and FarmHash produced different output depending on compiler and platform used.

It’s very likely that most of the above hash functions produce different output if ran on a big-endian CPU. I did not have any platform like that to test on.

Some of the hash functions depend on unaligned memory reads being possible – most notably Murmur and Spooky. I had to change Spooky to work on ARM 32 bit (define ALLOW_UNALIGNED_READS to zero in the source code). Murmur and Spooky did produce wrong results on asm.js (no crash, just different hash results and way more collisions than expected).

Conclusions

General cross-platform use: CityHash64 on a 64 bit system; xxHash32 on a 32 bit system.

  • Good performance across various data sizes.
  • Identical hash results across various little-endian platforms and compilers.
  • No weird compilation options to tweak or peformance drops on compilers that it is not tuned for.

Best throughput on large data: depends on platform!

  • Intel CPU: xxHash64 in general, FarmHash64 if you can use SSE4.2, xxHash32 if compiling for 32 bit.
  • Apple mobile CPU (A9): FarmHash64 for 64 bit, xxHash32 for 32 bit.
  • Console (XboxOne, AMD Jaguar): SpookyV2.
  • asm.js: xxHash32.

Best for short strings: FNV-1a.

  • Super simple to implement, inline-able.
  • Where exactly it becomes “generally fastest” depends on a platform; around 8 bytes or less on PC, mobile and console; around 20 bytes or less on asm.js.
  • If your data is fixed size (e.g. one or two integers), look into specialized hashes instead (see above).

SPIR-V Compression

$
0
0

TL;DR: Vulkan SPIR-V shaders are fairly large. SMOL-V can make them smaller.

Other folks are implementing Vulkan support at work, and the other day they noticed that Vulkan shaders (which are represented as SPIR-V binary format) take up quite a lot of space. I thought it would be a fun excercise to try to make them smoller, and maybe I’d learn something about compression along the way too.

Caveat emptor! I know nothing about compression. Or rather, I’m probably at the stage where I can make the impression that I know something about it, but all that knowledge is very superficial. Exactly the stage that is dangerous, if I start to talk about it as if I have a clue! So below, I’m doing exactly that. You’ve been warned.

SPIR-V format

SPIR-V is extremely simple and regular format. Everything is 4-byte words. Many things that only need a few bits of information are still represented as a word.

This makes it simple, but not exactly space efficient. I don’t have data nearby right now, but a year or so ago I looked into shaders that do the same thing, compiled for DX9, DX11, OpenGL (GLSL) and Vulkan (SPIR-V), and the SPIR-V were “fattest” by a large amount (DX9 and minified GLSL being the smallest).

Compressibility

“Why not just compress them?”, you ask. That should take care of these “three bits of information written as 4 bytes” style enums. That it does; standard lossless compression techniques are pretty good at encoding often occuring patterns into a small number of bits (further reading:Huffman, Arithmetic,FSE coding).

And indeed, SPIR-V compresses quite well. For example, 1315 kilobytes worth of shader data (from various Unity shaders) compresses to 279 kilobytes with Zstandard and to 306 kilobytes withzlib (I used miniz implementation) at default settings. So a standard go-to compression (zlib) gets you a 23.4% compression of SPIR-V.

However, SPIR-V is full of not-really-compressible things, mostly various identifiers (anything called <id> in thespec). Due to theSSA form that SPIR-V uses, all the identifiers ever used are unique numbers, with nothing reusing a previous ID. A regular data compressor does not get to see many repeating patterns there.

Data compression algorithms usually only look for literally repeating patterns. If you’d have a file full of 0x00000001 integers, this will compress extremely well. However, if your file will be a really simple sequence of integers: 1, 2, 3, 4, …, this will not compress particularly well!

I actually just tested this. 16384 four-byte words, which are just a sequence of 0,1,…,16383 integers, compressed with zlib at default settings: 64KB -> 22716 bytes.

Enter Data Filtering

Recall that “a simple sequence of numbers compresses quite poorly” example above? Turns out, a typical trick in data compression is to filter the data before compressing it. Filtering can be any sort of reversible transformation of the data, that makes it be more compressible, i.e. have more actually repeating patterns.

For example, using delta encoding on that integer sequence would transform it into a file that is pretty much all just 0x00000001 integers. This compresses with zlib into just 88 bytes!

Data filtering is fairly widely used, for example:

  • PNG image format has several filters, as described here.
  • Executable file compression usually transforms machine code instructions into a more compressible form, seetechniques used in .kkrunchy for example.
  • HDF5 scientific data format has filters likebitshuffle that reorder data before actual compression.
  • Some compressors like RAR seemingly automatically apply various filters to data blocks they identify as “filterable” (i.e. “looks like an executable” or “looks like sound wave samples” somehow).

Perhaps we could do some filtering on SPIR-V to make it more compressible?

Filtering: spirv-remap

In SPIR-V land, there is a tool called spirv-remap that aims to help with compression. What it does, is it changes all the IDs used in the shader to values that would hopefully be similar if you have a lot of other similar shaders, and compress them all as a whole. For each new ID, it “looks” at several surrounding instructions, and picks the ID based on their hash. The assumption is that you’re very likely to have other shaders that have similar fragments of instructions – they would be compressible if only the IDs would be the same.

And indeed, on that same set of shaders I had above: uncompressed size 1315KB, zstd-compressed 279KB (21.2%), remapped + zstd compressed: 189KB (14.4% compression).

However, spirv-remap tries to filter the SPIR-V program in a way that still results in a valid SPIR-V program. Maybe we could do better, if we did not have such a restriction?

SMOL-V: making SPIR-V smoller

So that’s what I did. My goal was to conceptually have two functions:

ByteArray Encode(const ByteArray& spirvInput); // SPIR-V -> SMOL-V
ByteArray Decode(const ByteArray& encodedBytes); // SMOL-V -> SPIR-V

with the goal that:

  • Encoded result would be smaller than input,
  • When compressed (with Zstd, zlib etc.), it would be smaller than if I just compressed the input,
  • When compressed, it would be smaller than what a compressed spirv-remap can achieve.
  • Do that in a fairly simple way. Since hey, I’m a compression n00b, anything that is compression rocket surgery is likely way out of my capabilities. Also, I wanted to roughly spend a (long) day on this.

So below is a write up of what I did (can also be seen in the commit history). First of all, I just looked at the SPIR-V binaries with a hex viewer. And in almost every step below, either looked at binaries, or printed bytes of instructions and looked for patterns.

Variable-length integer encoding: varint

Recall that SPIR-V uses four-byte words to store every single piece of information it needs. Often these are enum-style information that uses a few dozen possible values. I did not want to hardcode every possible operation & enum ranges (that would be a lot of work, and not very future-proof with later SPIR-V versions), so instead I looked at various variable-length integer storage schemes. Most famous is probably UTF-8 in text land. In binary data land there are VLQ,LEB128 and varint, which all are variations of “store 7 bits of data, and one bit to signal if there are more bytes following”. I picked the “varint” as used by Google Protocol Buffers, if only because I found it before I found the others :)

With varint encoding for unsigned integers, numbers below 128 take only one byte, numbers below 16384 take two bytes and so on.

So the very first try was to use varint encoding on each instruction’slength+opcode word, and the Type ID that many instructions have. Then I noticed that the Result IDs of almost every instructions are just one or two IDs larger then the result of a previous instruction. So I wrote them out as deltas from previous, and again encoded as varint.

This got just SMOL-V data to 71% size of original SPIR-V, and 18.2% when Zstd-compressed on top.

Relative-to-result and varint on often-occurring instructions

I dumped frequencies of how much space various opcode types take, and it became fairly clear that OpDecorate takes a lot, as well asOpVectorShuffle.

Now, decorations are guaranteed to be grouped, and often are specified on the same or very similar target IDs. The decoration values themselves are small integers. So, encode result IDs relative to a previously seen declarations, and use varint encoding on everything else (commit).

Vector shuffles also specify several IDs (often close to just-seen ones), and a few small component indices, so do a similar treatment for that (commit).

Combined, these took SMOL-V data to 56%, and 14.6% when Zstd-compressed.

I then noticed that the same pattern occurs in a lot of other instructions: the opcode, type and result IDs are often followed by several other IDs (how many depends on the opcode), and some other “usually small integer” values (how many, again depends on the opcode). So instead of just hardcoding handling of these several opcodes above, I generalized the code to look up this information into a table indexed by opcode.

After quite a lot more opcodes got this treatment, I was at 42% SMOL-V size, and 10.7% when Zstd-compressed. Not bad!

Negative deltas?

Most of the ID arguments I have encoded as a delta from previous Result ID value. The deltas were always positive so far, which is nice for varint encoding. However when I came to adding the same treatment to branch and control flow instructions, I realized that the IDs they reference are often“in the future”, which would mean the deltas are negative. Under the varint encoding, these would be the same as very large positive numbers, and often encode into 4 or 5 bytes.

Luckily, the same Protocol Buffers have a solution for that; signed integers get their bits shuffled so that small absolute values are turned into small positive values – theZigZag encoding. So I used that to encode IDs of control flow instructions.

Opcode value reordering

At this point tweaking just delta+varint encoding was starting to give diminishing returns. So I started looking at bytes again.

That “encode opcode + length as varint” was often producing 2 or 3 bytes worth of data, due to the way SPIR-V encodes that word. I tried reordering it so that most common opcodes&lenghts produce just one byte.

1) Swap opcode values so that most common ones fit into 4 bits. Most common ones in my shader test data were: Decorate (24%), Load (17%), Store (9%), AccessChain (7%), VectorShuffle (5%), MemberDecorate (4%) etc.

static SpvOp smolv_RemapOp(SpvOp op)
{
#	define _SMOLV_SWAP_OP(op1,op2) if (op==op1) return op2; if (op==op2) return op1
	_SMOLV_SWAP_OP(SpvOpDecorate,SpvOpNop); // 0
	_SMOLV_SWAP_OP(SpvOpLoad,SpvOpUndef); // 1
	_SMOLV_SWAP_OP(SpvOpStore,SpvOpSourceContinued); // 2
	_SMOLV_SWAP_OP(SpvOpAccessChain,SpvOpSource); // 3
	_SMOLV_SWAP_OP(SpvOpVectorShuffle,SpvOpSourceExtension); // 4
	// Name - already small value - 5
	// MemberName - already small value - 6
	_SMOLV_SWAP_OP(SpvOpMemberDecorate,SpvOpString); // 7
	_SMOLV_SWAP_OP(SpvOpLabel,SpvOpLine); // 8
	_SMOLV_SWAP_OP(SpvOpVariable,(SpvOp)9); // 9
	_SMOLV_SWAP_OP(SpvOpFMul,SpvOpExtension); // 10
	_SMOLV_SWAP_OP(SpvOpFAdd,SpvOpExtInstImport); // 11
	// ExtInst - already small enum value - 12
	// VectorShuffleCompact - already small value - used for compact shuffle encoding
	_SMOLV_SWAP_OP(SpvOpTypePointer,SpvOpMemoryModel); // 14
	_SMOLV_SWAP_OP(SpvOpFNegate,SpvOpEntryPoint); // 15
#	undef _SMOLV_SWAP_OP
	return op;
}

2) Adjust opcode lengths so that most common ones fit into 3 bits.

// For most compact varint encoding of common instructions, the instruction length
// should come out into 3 bits. SPIR-V instruction lengths are always at least 1,
// and for some other instructions they are guaranteed to be some other minimum
// length. Adjust the length before encoding, and after decoding accordingly.
static uint32_t smolv_EncodeLen(SpvOp op, uint32_t len)
{
	len--;
	if (op == SpvOpVectorShuffle)			len -= 4;
	if (op == SpvOpVectorShuffleCompact)	len -= 4;
	if (op == SpvOpDecorate)				len -= 2;
	if (op == SpvOpLoad)					len -= 3;
	if (op == SpvOpAccessChain)				len -= 3;
	return len;
}
static uint32_t smolv_DecodeLen(SpvOp op, uint32_t len)
{
	len++;
	if (op == SpvOpVectorShuffle)			len += 4;
	if (op == SpvOpVectorShuffleCompact)	len += 4;
	if (op == SpvOpDecorate)				len += 2;
	if (op == SpvOpLoad)					len += 3;
	if (op == SpvOpAccessChain)				len += 3;
	return len;
}

3) Interleave bits of the original word so that these common ones (opcode + lenght) take up lowest seven bits of the result, and encode to just one byte in varint scheme. 0xLLLLOOOO is how SPIR-V encodes it (L=length, O=op), shuffle it into 0xLLLOOOLO so that common case (op<16, len<8) is encoded into one byte.

That got things down to 35% SMOL-V size, and 9.7% when Zstd-compressed.

Vector Shuffle encoding

SPIR-V has a single opcode OpVectorShuffle that is used for both selecting components from two vectors, and for a typical “swizzle”. Swizzles are by far the most common in the shaders I’ve seen, so often in raw SPIR-V something like “v.xxyy” swizzle ends up being “v, v, 0, 0, 1, 1” - each of these being a full 32 bit word (both arguments point to the same vector, and then component indices spelled out).

I made the code recognize this common pattern of “shuffle with <= 4 components, where each is between 0 and 3”, and encode that as a fake “VectorShuffleCompact” opcode using one of the unused opcode values, 13. The swizzle pattern fits into one byte (two bits per channel) instead taking up 16 bytes (commit).

Adding non-Unity shaders, and zigzag

At this point I added more shaders to test on, to see how everything above behaves on non-Unity compilation pipeline produced shaders (thanks @baldurk, @AlenL and@basisspace for providing and letting me use shaders from The Talos Principle and DOTA2).

Turns out, both of these games ship with shaders that are alreayd processed with spirv-remap. One thing it does (well, the primary thing it does!) is changing all the IDs to not be linearly increasing, but have values all over the place. My previous work on using delta encoding and varint output was often going against that, since often it would be that next ID would be smaller than previous one, resulting in negative delta, which encodes into 4 or 5 bytes under varint. Not good!

Well it wasn’t bad; this is SMOL-V that not only compresses, but also strips debug info, to match what spirv-remap did for Talos/DOTA2 case:

  • Unity: remap+zstd 13.0%, SMOL-V+zstd 7.2%.
  • Talos: remap+zstd 11.1%, SMOL-V+zstd 9.0%.
  • DOTA2: remap+zstd 9.9%, SMOL-V+zstd 8.4%.

It already compresses better than spirv-remap, but is more better on shaders that aren’t already remapped.

I switched all the deltas to use zigzag encoding (see Negative Deltas above), so that on already remapped shaders it does not go into “whoops encoded into 5 bytes”:

  • Unity: remap+zstd 13.0%, SMOL-V+zstd 7.3% (a tiny bit worse than 7.2% before).
  • Talos: remap+zstd 11.1%, SMOL-V+zstd 8.5% (yay, was 9.0% before).
  • DOTA2: remap+zstd 9.9%, SMOL-V+zstd 8.2% (small yay, was 8.4% before).

MemberDecorate encoding

Structure/buffer decorations (OpMemberDecorate) were taking up quite a bit of space, so I looked for some patterns in them.

Most often they are very simple sequences, e.g.

Op             Type Member Decoration Extra
MemberDecorate 168  0      35           0 
MemberDecorate 168  1      35          64 
MemberDecorate 168  2      35          80 
MemberDecorate 168  3      35          96 
MemberDecorate 168  4      35         112 
MemberDecorate 168  5      35         128 
MemberDecorate 168  6       0 
MemberDecorate 168  6      35         384 
MemberDecorate 168  7      35         400 

When encoding, I scan ahead to see whether there’s a sequence of MemberDecorate instructions that are all about the same type, and “fold” them into one – so I can skip writing out opcode+lenght and type ID data. Additionally, delta encode member index, and have special handling of decoration 35 (“Offset”, which is extremely common) to store actual offset as delta from previous one. This got some gains (commit).

Quite likely OpDecorate sequences could get a similar treatment, but I did not do that yet.

Current status

So that’s about it! Current compression numbers, on a set of Unity+Talos+DOTA2 shaders, with debug info stripping:

CompressionNo filter (*)spirv-remapSMOL-V
Size KBRatioSize KBRatioSize KBRatio
Uncompressed3725.4100.0%3560.095.6%1297.634.8%
zlib default860.623.1%761.920.5%464.912.5%
LZ4HC default884.423.7%743.320.0%441.011.8%
Zstd default555.414.9%425.611.4%295.57.9%
Zstd level 20339.49.1%260.57.0%226.76.1%

(*) Note: about 2/3rds of the shader (Talos & DOTA2) set were already processed by spirv-remap; I don’t have unprocessed shaders from these games. This makes spirv-remap look a bit worse than it actually is though.

I think it’s not too bad for a couple days of work. And I have learned a thing or two about compression. Again, the github repository is here: github.com/aras-p/smol-v.

  • Encoding does a simple one-pass scan over the input (with occasional look aheads for MemberDecorate sequences), and writes encoded result to the output.
  • Decoding simply goes over encoded bytes and transforms into SPIR-V. One pass over data, no memory allocations.
  • No “altering” of SPIR-V programs is done; what you encode is exactly what you get after decoding (this is different from spirv-remap, that actually changes the IDs). Exception is the kEncodeFlagStripDebugInfo that removes debug information from the input program.

Future Work?

Not sure I will work on this much (as opposed to “eh, good enough for now”), but possible future work might be:

  • Someone who actually knows about compression will look at it, and point out low hanging fruits :)
  • Do special encoding of some more opcodes (OpDecorate comes to mind).
  • Split up encoded data into several “streams” for better compression (e.g. lenghts, opcodes, types, results, etc.). Very similar to the “Split-stream encoding” from .kkrunchy blog post.
  • As John points out, there are other possible axes to explore compression.

This was super fun. I highly recommend “short, useful, and you get to learn something” projects :)

Shader Compression: Some Data

$
0
0

One common question I had about SPIR-V Compression is “why compress shaders at all?“, coupled with question on how SPIR-V shaders compare with shader sizes on other platforms.

Here’s some data (insert usual caveats: might be not representative, etc. etc.).

Unity Standard shader, synthetic test

Took Unity’s Standard shader, made some content to make it expand into 482 actual shader variants (some variants to handle different options in the UI, some to handle different lighting setups, lightmaps, shadows and whatnot etc.). This is purely a synthetic test, and not an indicator of any “likely to match real game data size” scenario.

These 482 shaders, when compiled into various graphics API shader representations with our current (Unity 5.5) toolchain, result in sizes like this:

APIUncompressed MBLZ4HC Compressed MB
D3D91.040.14
D3D111.390.12
Metal2.550.20
OpenGL2.040.15
Vulkan6.841.63
Vulkan + SMOL-V1.940.43

Basically, SPIR-V shaders are 5x larger than D3D11 shaders, and 3x larger than GL/Metal shaders. When compressed (LZ4HC used since that’s what we use to compress shader code), they are 12x larger than D3D11 shaders, and 8x larger than GL/Metal shaders.

Adding SMOL-V encoding gets SPIR-V shaders to “only” be 3x larger than shaders of other APIs when compressed.

Game, full set of shaders

I also got numbers from one game developer trying out SMOL-V on their game. The game is inhouse engine, size of full game shader build:

APIUncompressed MBZipped MB
D3D114414
Vulkan + remap17862
Vulkan + remap + SMOL-V8354

Here again, SPIR-V shaders are several times larger (than for example DX11), even after remapping + compression. Adding SMOL-V makes them a bit smaller (I suspect without remapping it might be even smoller).

In context

However, in the bigger picture shader compression might indeed not be a thing worth looking into. As always,“it depends”…

Adding smol-v encoding on this game’s data saved 15 megabytes. On one hand, it’s ten floppy disks, which is almost as much as entireWindows 95 took! On the other hand, it’s about the size of one 4kx4k texture, when DXT5/BC7 compressed.

So yeah. YMMV.

Interview questions

$
0
0

Recently saw quite some twitter discussions about good & bad interview questions. Here’s a few I found useful.

In general, the most useful questions seem to be fairly open-ended ones, that can either lead to a much larger branching discussions, or don’t even have the “right” answer. Afterall, you mostly don’t want to know the answer (it’s gonna be 42 anyway), but to see the problem solving process and/or evaluate general knowledge and grasp of the applicant.

The examples below are what I have used some times, and are targeted at graphics programmers with some amount of experience.

When a GPU samples a texture, how does it pick which mipmap level to read from?

Ok this one does have the correct answer, but it still can lead to a lot of discussion. The correct answer today is along the lines of:

GPU rasterizes everything in 2x2 fragment blocks, computes horizontal and vertical texture coordinate differences between fragments in the block, and uses magnitudes of the UV differences to pick the mipmap level that most closely matches 1:1 ratio of fragments to texels.

If the applicant does not know the answer, you could try to derive it. “Well ok, if you were building a GPU or writing a software rasterizer, what would you do?“.

Most people initially go for “based on distance to the camera”, or “based on how big the triangle is on screen” and so on. This is a great first step (and was roughly how rasterizers in the really old days worked). You can up the challenge then by throwing in a “but what if UVs are not just computed per-vertex?”. Which of course makes these suggested approaches not suitable anymore, and something else has to be thought up.

Once you get to the 2x2 fragment block solution, more things can be discussed (or just jump here if the applicant already knew the answer). What implications does it have for the programming models, efficiency etc.? Possible things to discuss:

  • The 2x2 quad has to execute shader instructions in lockstep, so that UV differences can be computed. Which leads to branching implications, which leads to regular texture samples being disallowed (HLSL) or undefined (GLSL) when used inside dynamic branching code paths.
  • Lockstep execution can lead into discussion how the GPUs work in general; what are the wavefronts / warps / SIMDs (or whatever your flavor of API/GPU calls them). How branching works, how temporary variable storage works, how to optimize occuppancy, how latency hiding works etc. Could spend a lot of time discussing this.
  • 2x2 quad rasterization means inefficiencies at small triangle sizes (a triangle that covers 1 fragment will still get four fragment shader executions). What implications this has for high geometry density, tessellation, geometric LOD schemes. What implications this has for forward vs deferred shading. What research is done to solve this problem, is the applicant aware of it? What would they do to solve or help with this?

You are designing a lighting system for a game/engine. What would it be?

This one does not even have the “correct” answer. A lighting system could be anything, there’s at least a few dozen commonly used ways to do it, and probably millions of more specialized ways! Lighting encompasses a lot of things – punctual, area, environment light sources, emissive surfaces; realtime and baked illumination components; direct and global illumination; shadows, reflections, volumetrics; tradeoffs between runtime peformance and authoring performance, platform implications, etc. etc. It can be a really long discussion.

Here, you’re interested in several things:

  • General thought process and how do they approach open-ended problems. Do they clarify requirements and try to narrow things down? Do they tell what they do know, what they do not know, and what needs further investigation? Do they just present a single favorite technique of theirs and can’t tell any downsides of it?
  • Awareness of already existing solutions. Do they know what is out there, and aware of pros & cons of common techniques? Have they tried any of it themselves? How up-to-date is their knowledge?
  • Exploring the problem space and making decisions. Is the lighting system for a single very specific game, or does it have to be general and “suitable for anything”? How does that impact the possible choices, and what are consequences of these choices? Likewise, how does choice of hardware platforms, minimum specs, expected complexity of content and all other factors affect the choices?
  • Dealing with tradeoffs. Almost every decisions engineers do involve tradeoffs of some kind - by picking one way of doing something versus some other way, you are making a tradeoff. It could be performance, usability, flexibility, platform reach, implementation complexity, workflow impact, amount of learning/teaching that has to be done, and so on. Do they understand the tradeoffs? Are they aware of pros & cons of various techniques, or can they figure them out?

You are implementing a graphics API abstraction for an engine. How would it look like?

Similar to the lighting question above, there’s no single correct answer.

This one tests awareness of current problem space (console graphics APIs, “modern” APIs like DX12/Vulkan/Metal, older APIs like DX11/OpenGL/DX9). What do they like and dislike in the existing graphics APIs (red flag if they “like everything” – ideal APIs do not exist). What would they change, if they could?

And again, tradeoffs. Would they go for power/performance or ease of use? Can you have both (if “yes” - why and how? if “no” - why?). Do they narrow down the requirements of who the abstraction users would be? Would their abstraction work efficiently on underlying graphics APIs that do not closely map to it?

You need to store and render a large city. How would you do it?

This one I haven’t used, but saw someone mention on twitter. Sounds like an excellent question to me, again because it’s very open ended and touches a lot of things.

Authoring, procedural authoring, baking, runtime modification, storage, streaming, spatial data structures, levels of detail, occlusion, rendering, lighting, and so on. Lots and lots of discussion to be had.

Well this is all.

That said, it’s been ages since I took a job interview myself… So I don’t know if these questions are as useful for the applicants as they seem for me :)

Amazing Optimizers, or Compile Time Tests

$
0
0

I wrote some tests to verify sorting/batching behavior in rendering code, and they were producing different results on Windows (MSVC) vs Mac (clang). The tests were creating a “random fake scene” with a random number generator, and at first it sounded like our “get random normalized float” function was returning slightly different results between platforms (which would be super weird, as in how come no one noticed this before?!).

So I started digging into random number generator, and the unit tests it has. This is what amazed me.

Here’s one of the unit tests (we use a custom native test framework that started years ago on an old version ofUnitTest++):

TEST (Random01_WithSeed_RestoredStateGenerateSameNumbers)
{
	Rand r(1234);
	Random01(r);
	RandState oldState = r.GetState();
	float prev = Random01(r);
	r.SetState(oldState);
	float curr = Random01(r);
	CHECK_EQUAL (curr, prev);
}

Makes sense, right?

Here’s what MSVC 2010 compiles this down into:

push        rbx  
sub         rsp,50h  
mov         qword ptr [rsp+20h],0FFFFFFFFFFFFFFFEh  
	Rand r(1234);
	Random01(r);
	RandState oldState = r.GetState();
	float prev = Random01(r);
movss       xmm0,dword ptr [__real@3f47ac02 (01436078A8h)]  
movss       dword ptr [prev],xmm0  
	r.SetState(oldState);
	float curr = Random01(r);
mov         eax,0BC5448DBh  
shl         eax,0Bh  
xor         eax,0BC5448DBh  
mov         ecx,0CE6F4D86h  
shr         ecx,0Bh  
xor         ecx,eax  
shr         ecx,8  
xor         eax,ecx  
xor         eax,0CE6F4D86h  
and         eax,7FFFFFh  
pxor        xmm0,xmm0  
cvtsi2ss    xmm0,rax  
mulss       xmm0,dword ptr [__real@34000001 (01434CA89Ch)]  
movss       dword ptr [curr],xmm0  
	CHECK_EQUAL (curr, prev);
call        UnitTest::CurrentTest::Details (01420722A0h)
; ...

There’s some bit operations going on (the RNG is Xorshift 128), looks fine on the first glance.

But wait a minute; this seems like it only has code to generate a random number once, whereas the test is supposed to call Random01 three times?!

Turns out the compiler is smart enough to see through some of the calls, folds down all these computations and goes, “yep, so the 2nd call to Random01 will produce 0.779968381 (0x3f47ac02)“. And then it kinda partially does actual computation of the 3rd Random01 call, and eventually checks that the result is the same.

Oh-kay!

Now, what does clang (whatever version Xcode 8.1 on Mac has) do on this same test?

pushq  %rbp
movq   %rsp, %rbp
pushq  %rbx
subq   $0x58, %rsp
movl   $0x3f47ac02, -0xc(%rbp)   ; imm = 0x3F47AC02 
movl   $0x3f47ac02, -0x10(%rbp)  ; imm = 0x3F47AC02 
callq  0x1002b2950               ; UnitTest::CurrentTest::Results at CurrentTest.cpp:7
; ...

Whoa. There’s no code left at all! Everything just became an “is 0x3F47AC02 == 0x3F47AC02” test. It became a compile-time test.

w(☆o◎)w

By the way, the original problem I was looking into? Turns out RNG is fine (phew!). What got me was code in my own test that I should have known better about; it was roughly like this:

transform.SetPosition(Vector3f(Random01(), Random01(), Random01()));

See what’s wrong?

.

.

.

The function argument evaluation order in C/C++ is unspecified.

(╯°□°)╯︵ ┻━┻

Newer languages like C# or Java have guarantees that arguments are evaluated from left to right. Yay sanity.

Viewing all 256 articles
Browse latest View live